Dashboard
See how many machines are stopped or working right now, and your plant's availability, stop classification and main stop causes for today, yesterday or the week.
Dashboard, the first item in the left-hand menu, is a one-page summary of your plant. At the top it counts your machines by their current state; below, GENERAL INDICATORS summarize availability, stop classification and stop causes for the period you choose. It covers the machines selected in the machine group selector in the top bar.
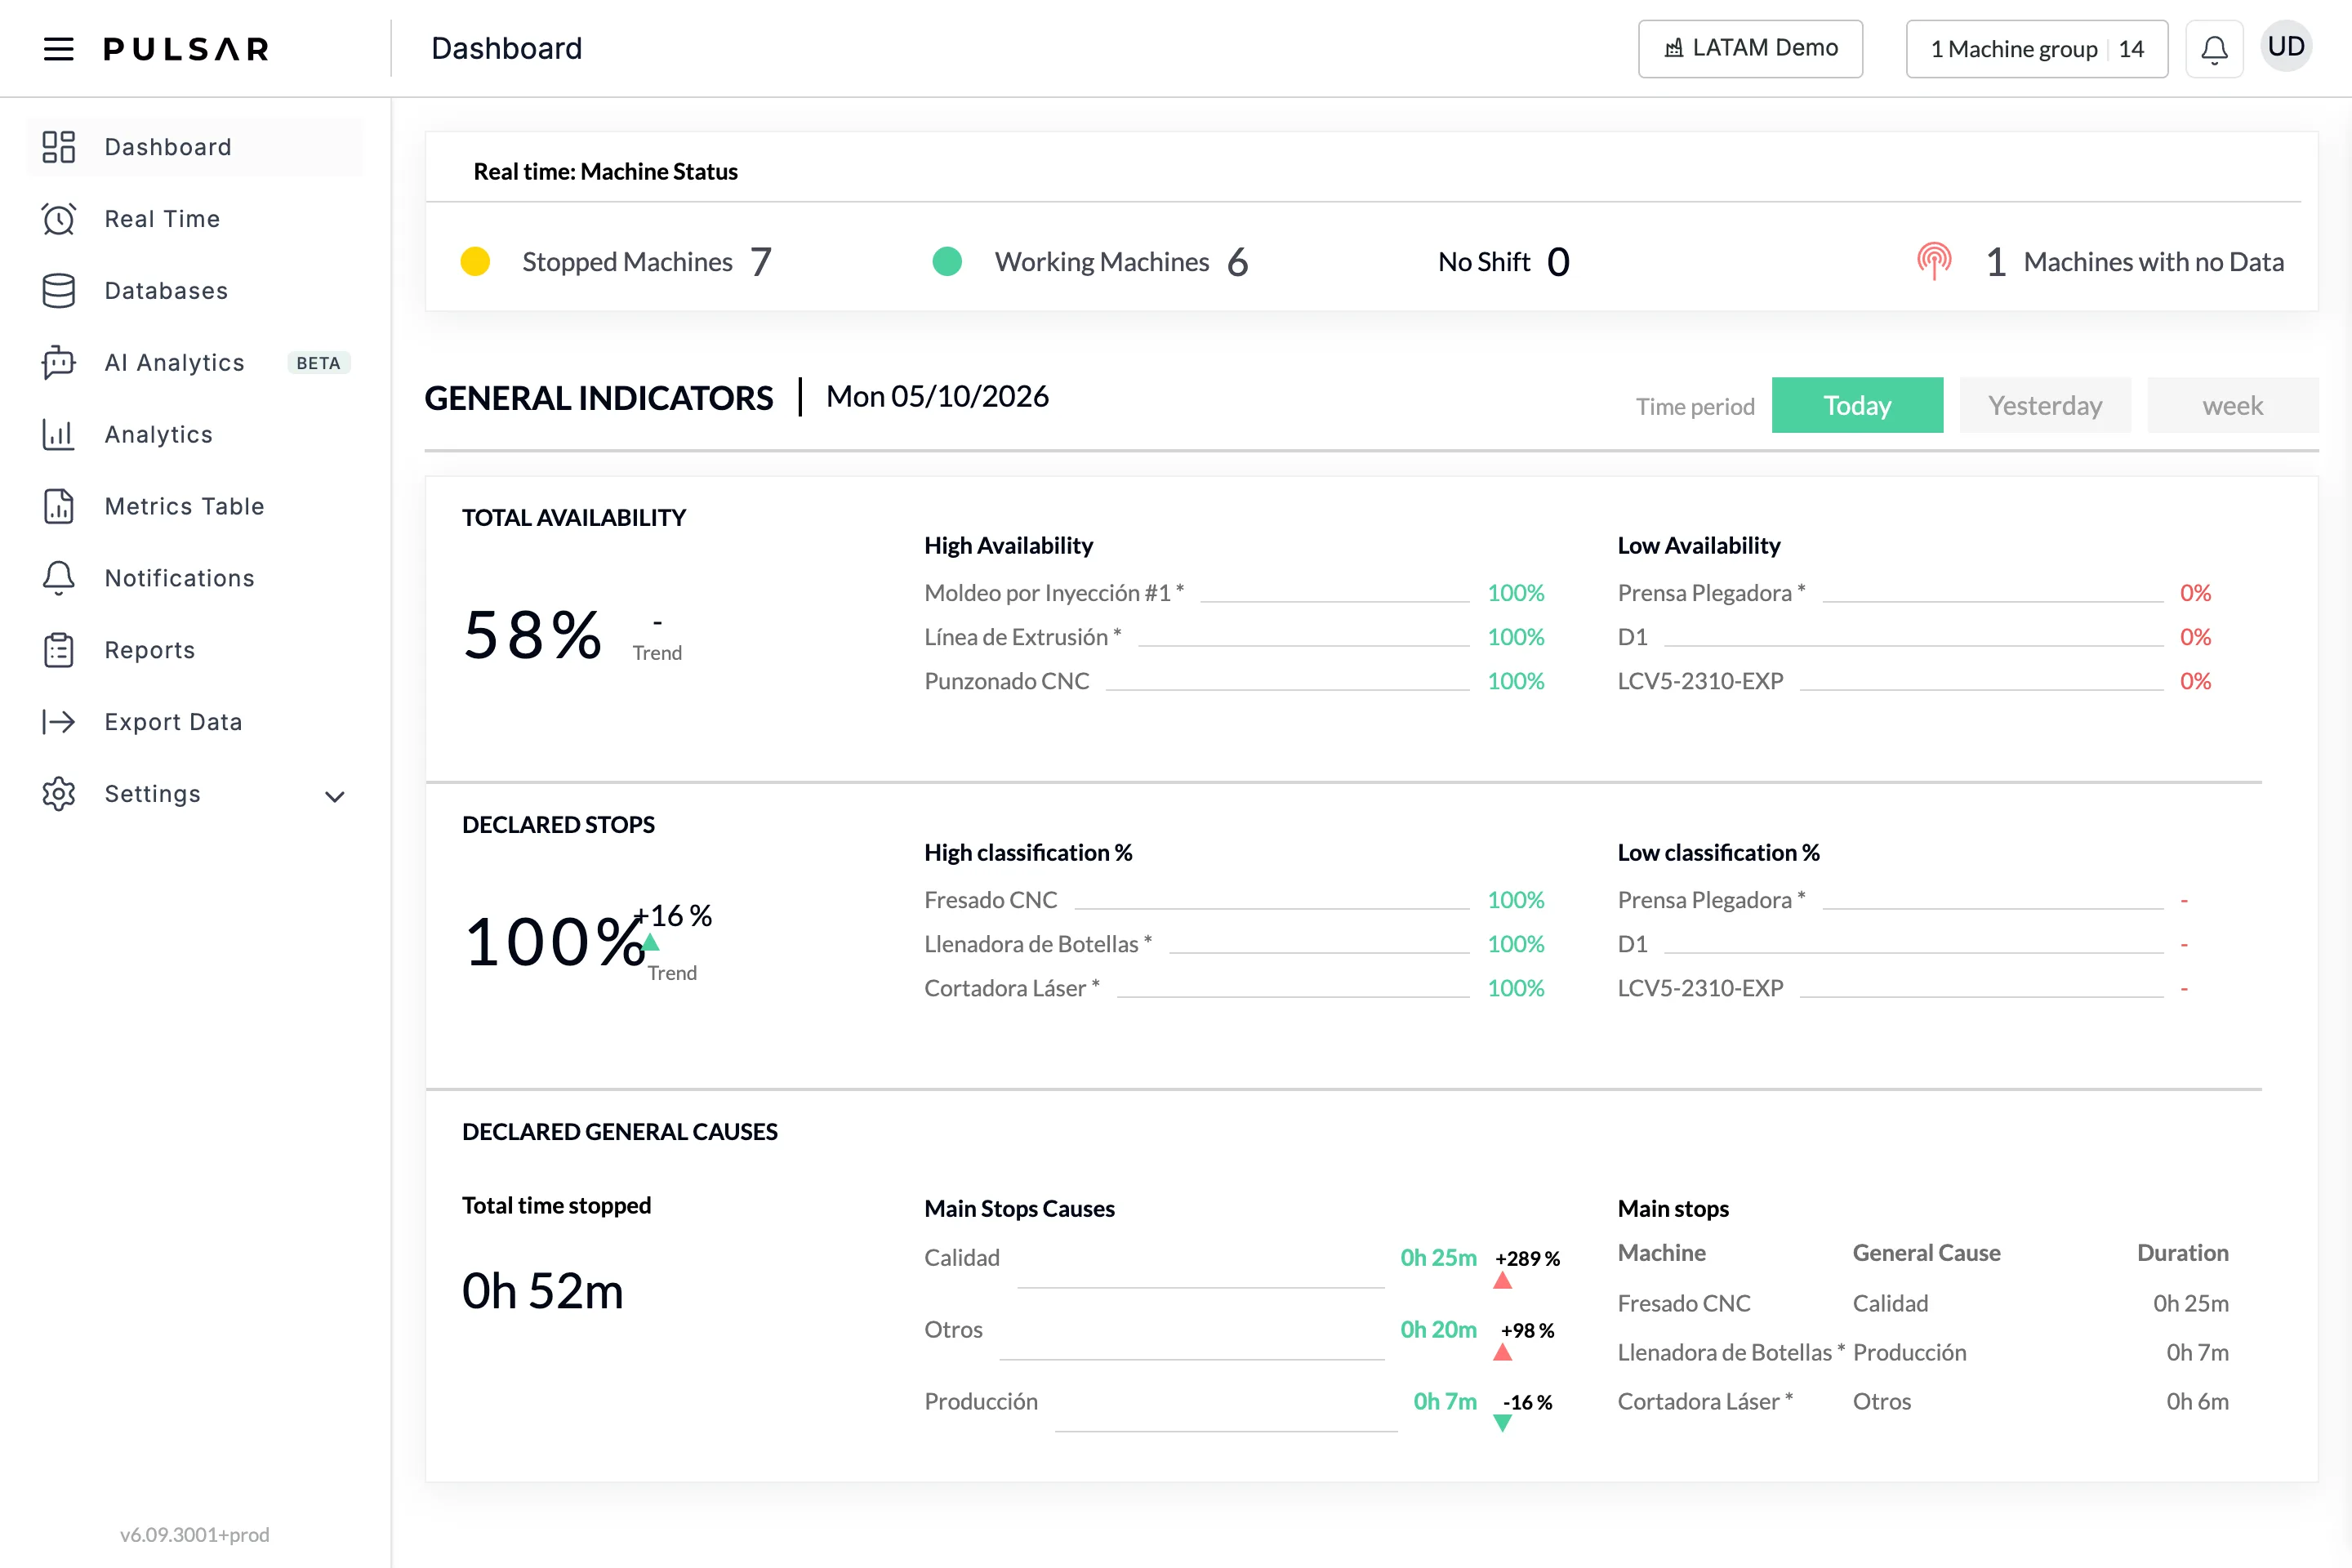
Real time: Machine Status
This section shows how many machines are in each state right now:
- Stopped Machines, with a yellow dot
- Working Machines, with a green dot
- No Shift: machines outside a scheduled shift
- Machines with no Data: machines that aren't sending data
The four counts add up to the machines in the machine group selector. To see each machine's card and what it's doing, open Real Time.
General indicators
Next to GENERAL INDICATORS is the date. Under Time period, choose Today, Yesterday or week. The three sections below update for that period.
Total availability
TOTAL AVAILABILITY shows the plant's availability as a percentage, with its Trend. High Availability lists the three machines with the highest availability and Low Availability the three with the lowest, each with its percentage.
Declared stops
DECLARED STOPS shows the percentage of stops that have been classified, with its Trend. High classification % and Low classification % list the three machines with the most and the least of their stops classified. To classify stops, see Stops.
Declared general causes
DECLARED GENERAL CAUSES shows:
- Total time stopped in the period
- Main Stops Causes: the general causes with the most stopped time, each with its time and percentage change
- Main stops: the longest stops, with their Machine, General Cause and Duration