Metrics table
View the KPIs Pulsar calculates for your shifts in a table, group them by machine, SKU, operator, shift and period, and download the table.
The Metrics Table shows the KPIs Pulsar calculates across your shifts in table form, grouped by the filters you choose.
Video
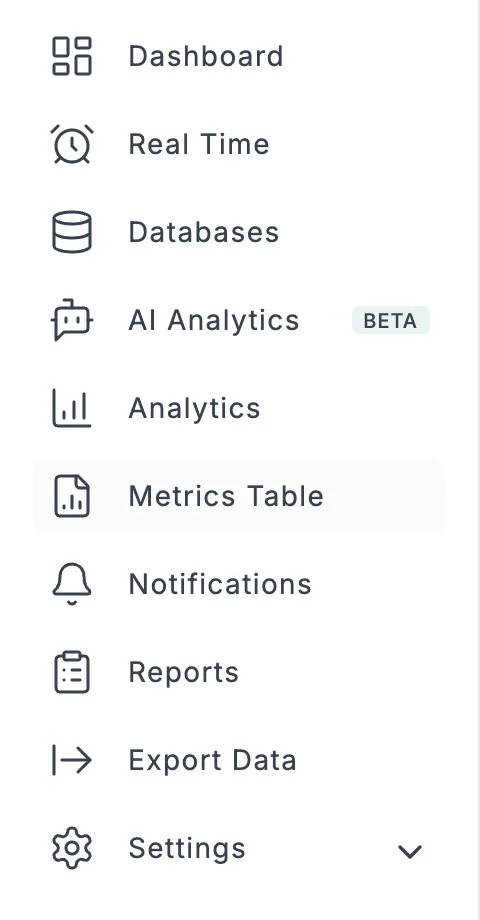
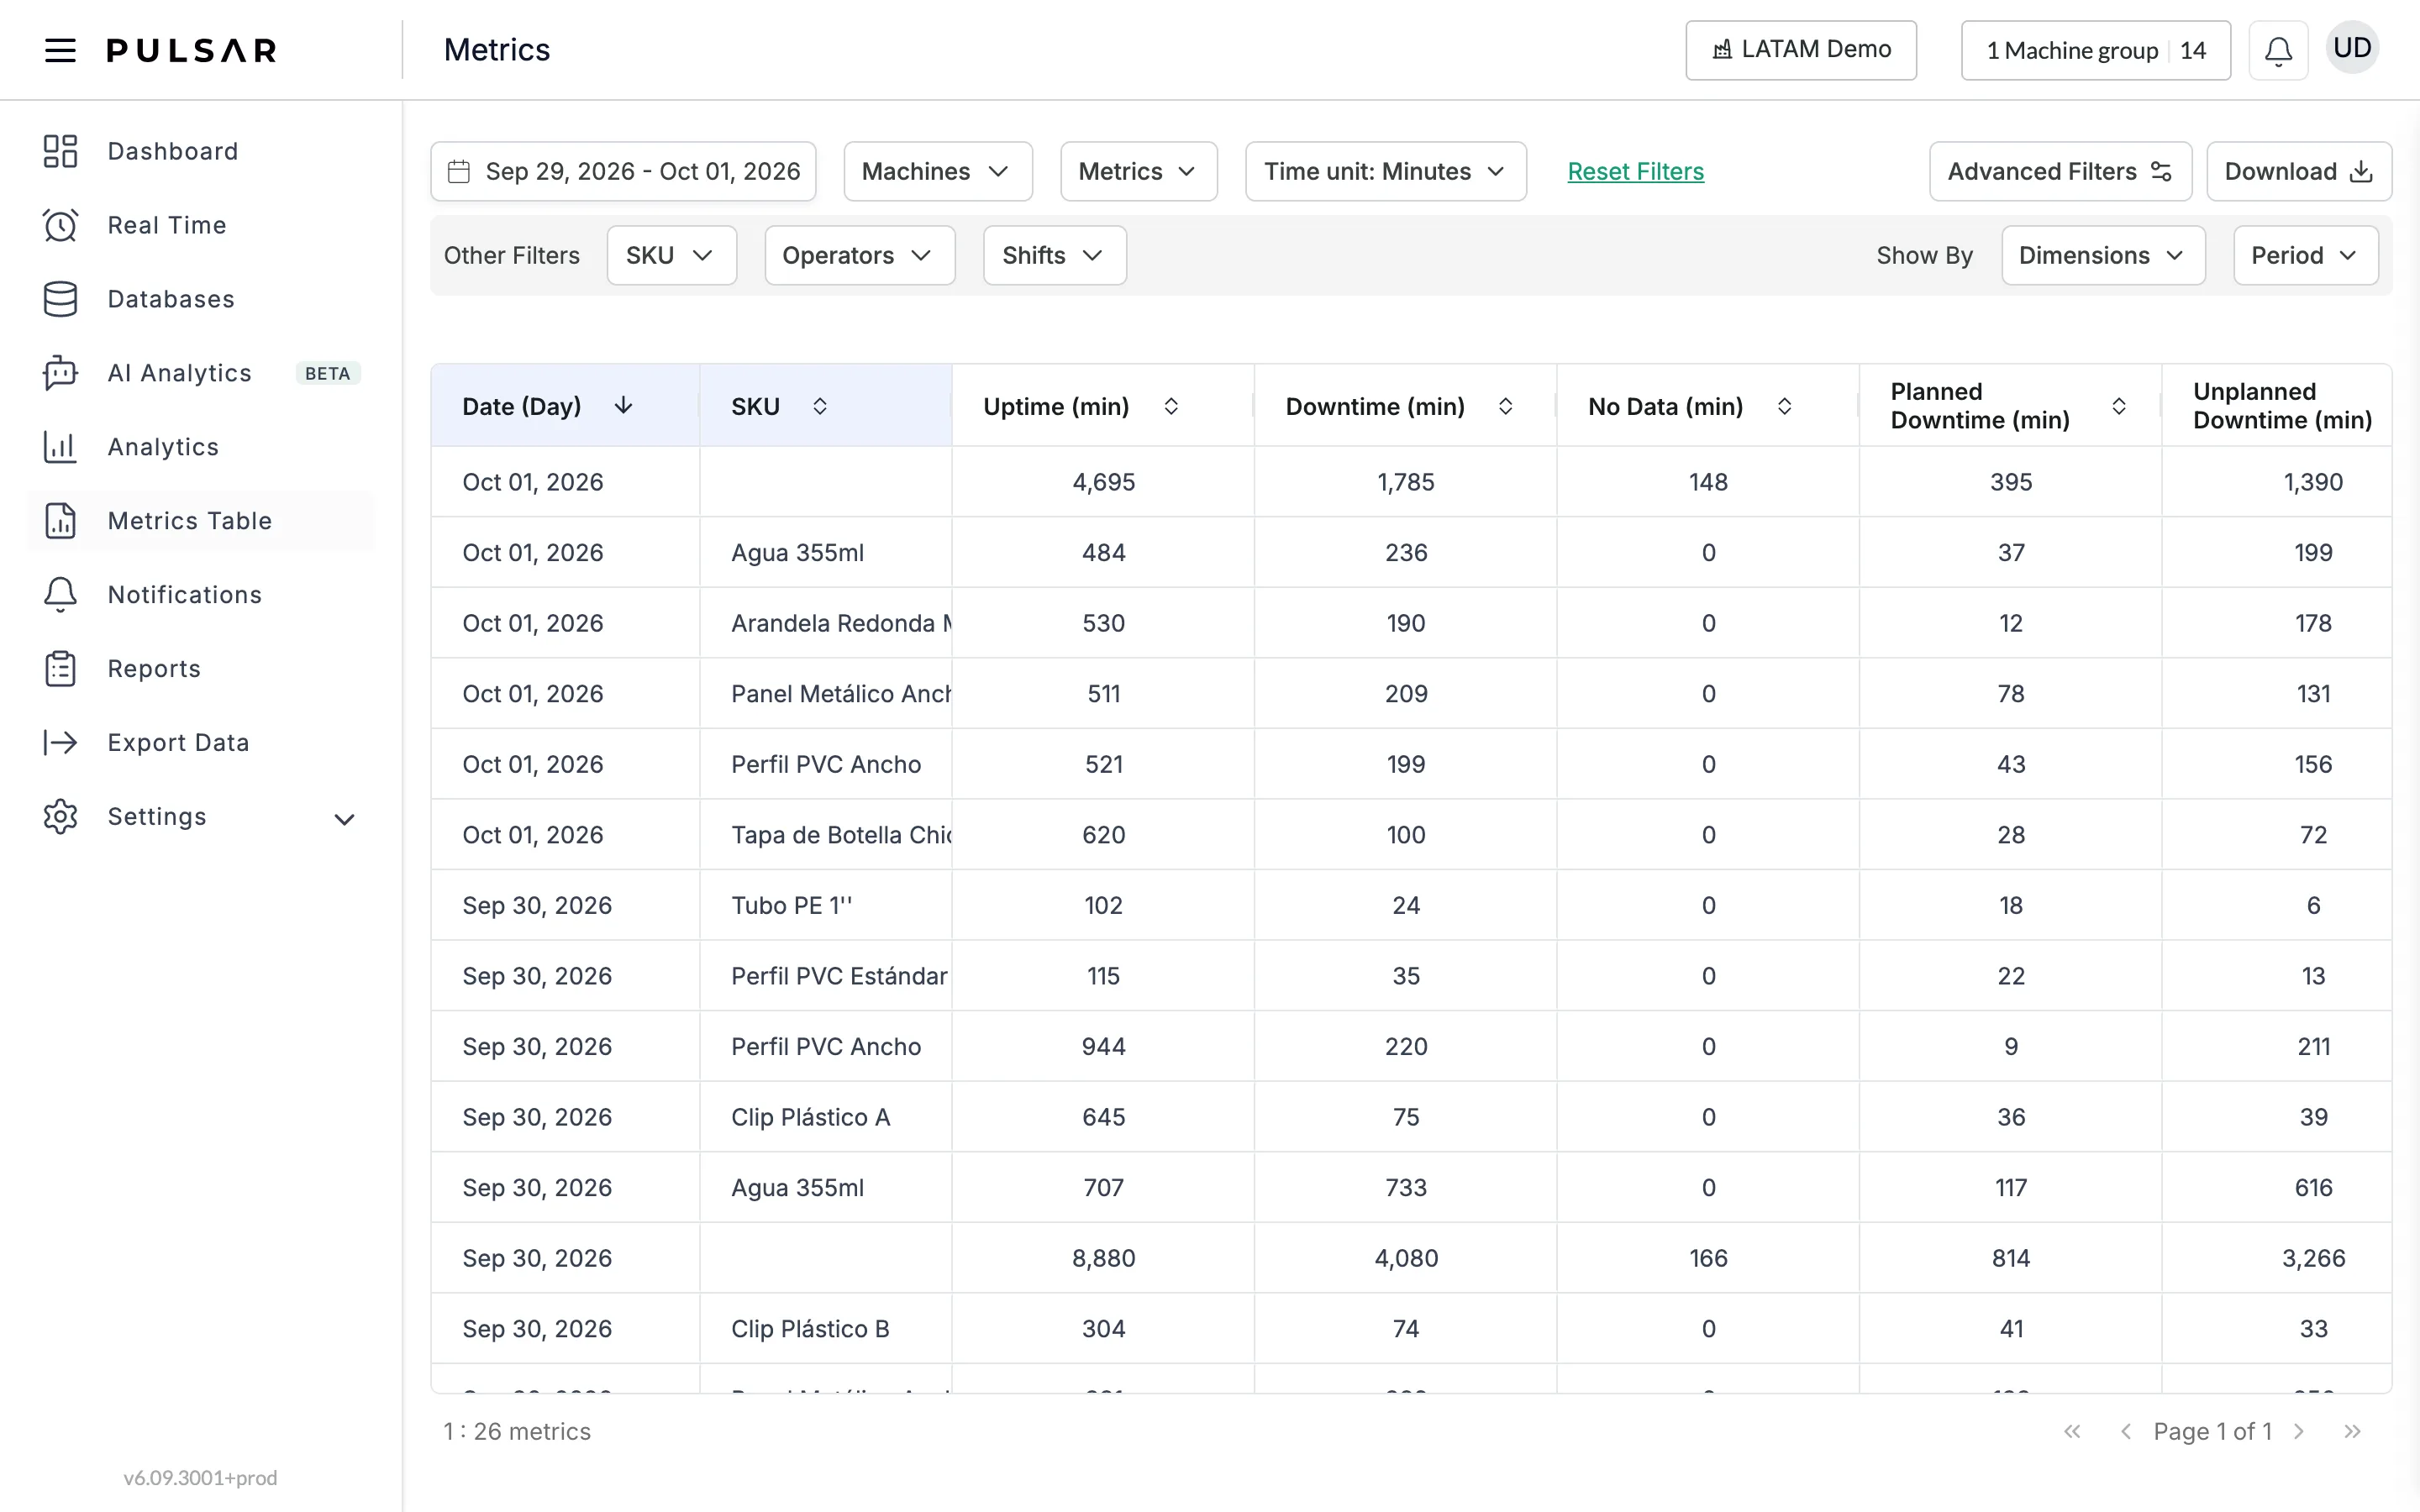
Click Metrics Table in the left-hand menu. The Metrics page opens with one row per day and a column per metric: Uptime (min), Downtime (min), No Data (min), Planned Downtime (min), Unplanned Downtime (min), Availability, Net Availability, Total Products, Correct Products, Defects, Speed, Performance, Quality and OEE. Click a column's header to sort by it.
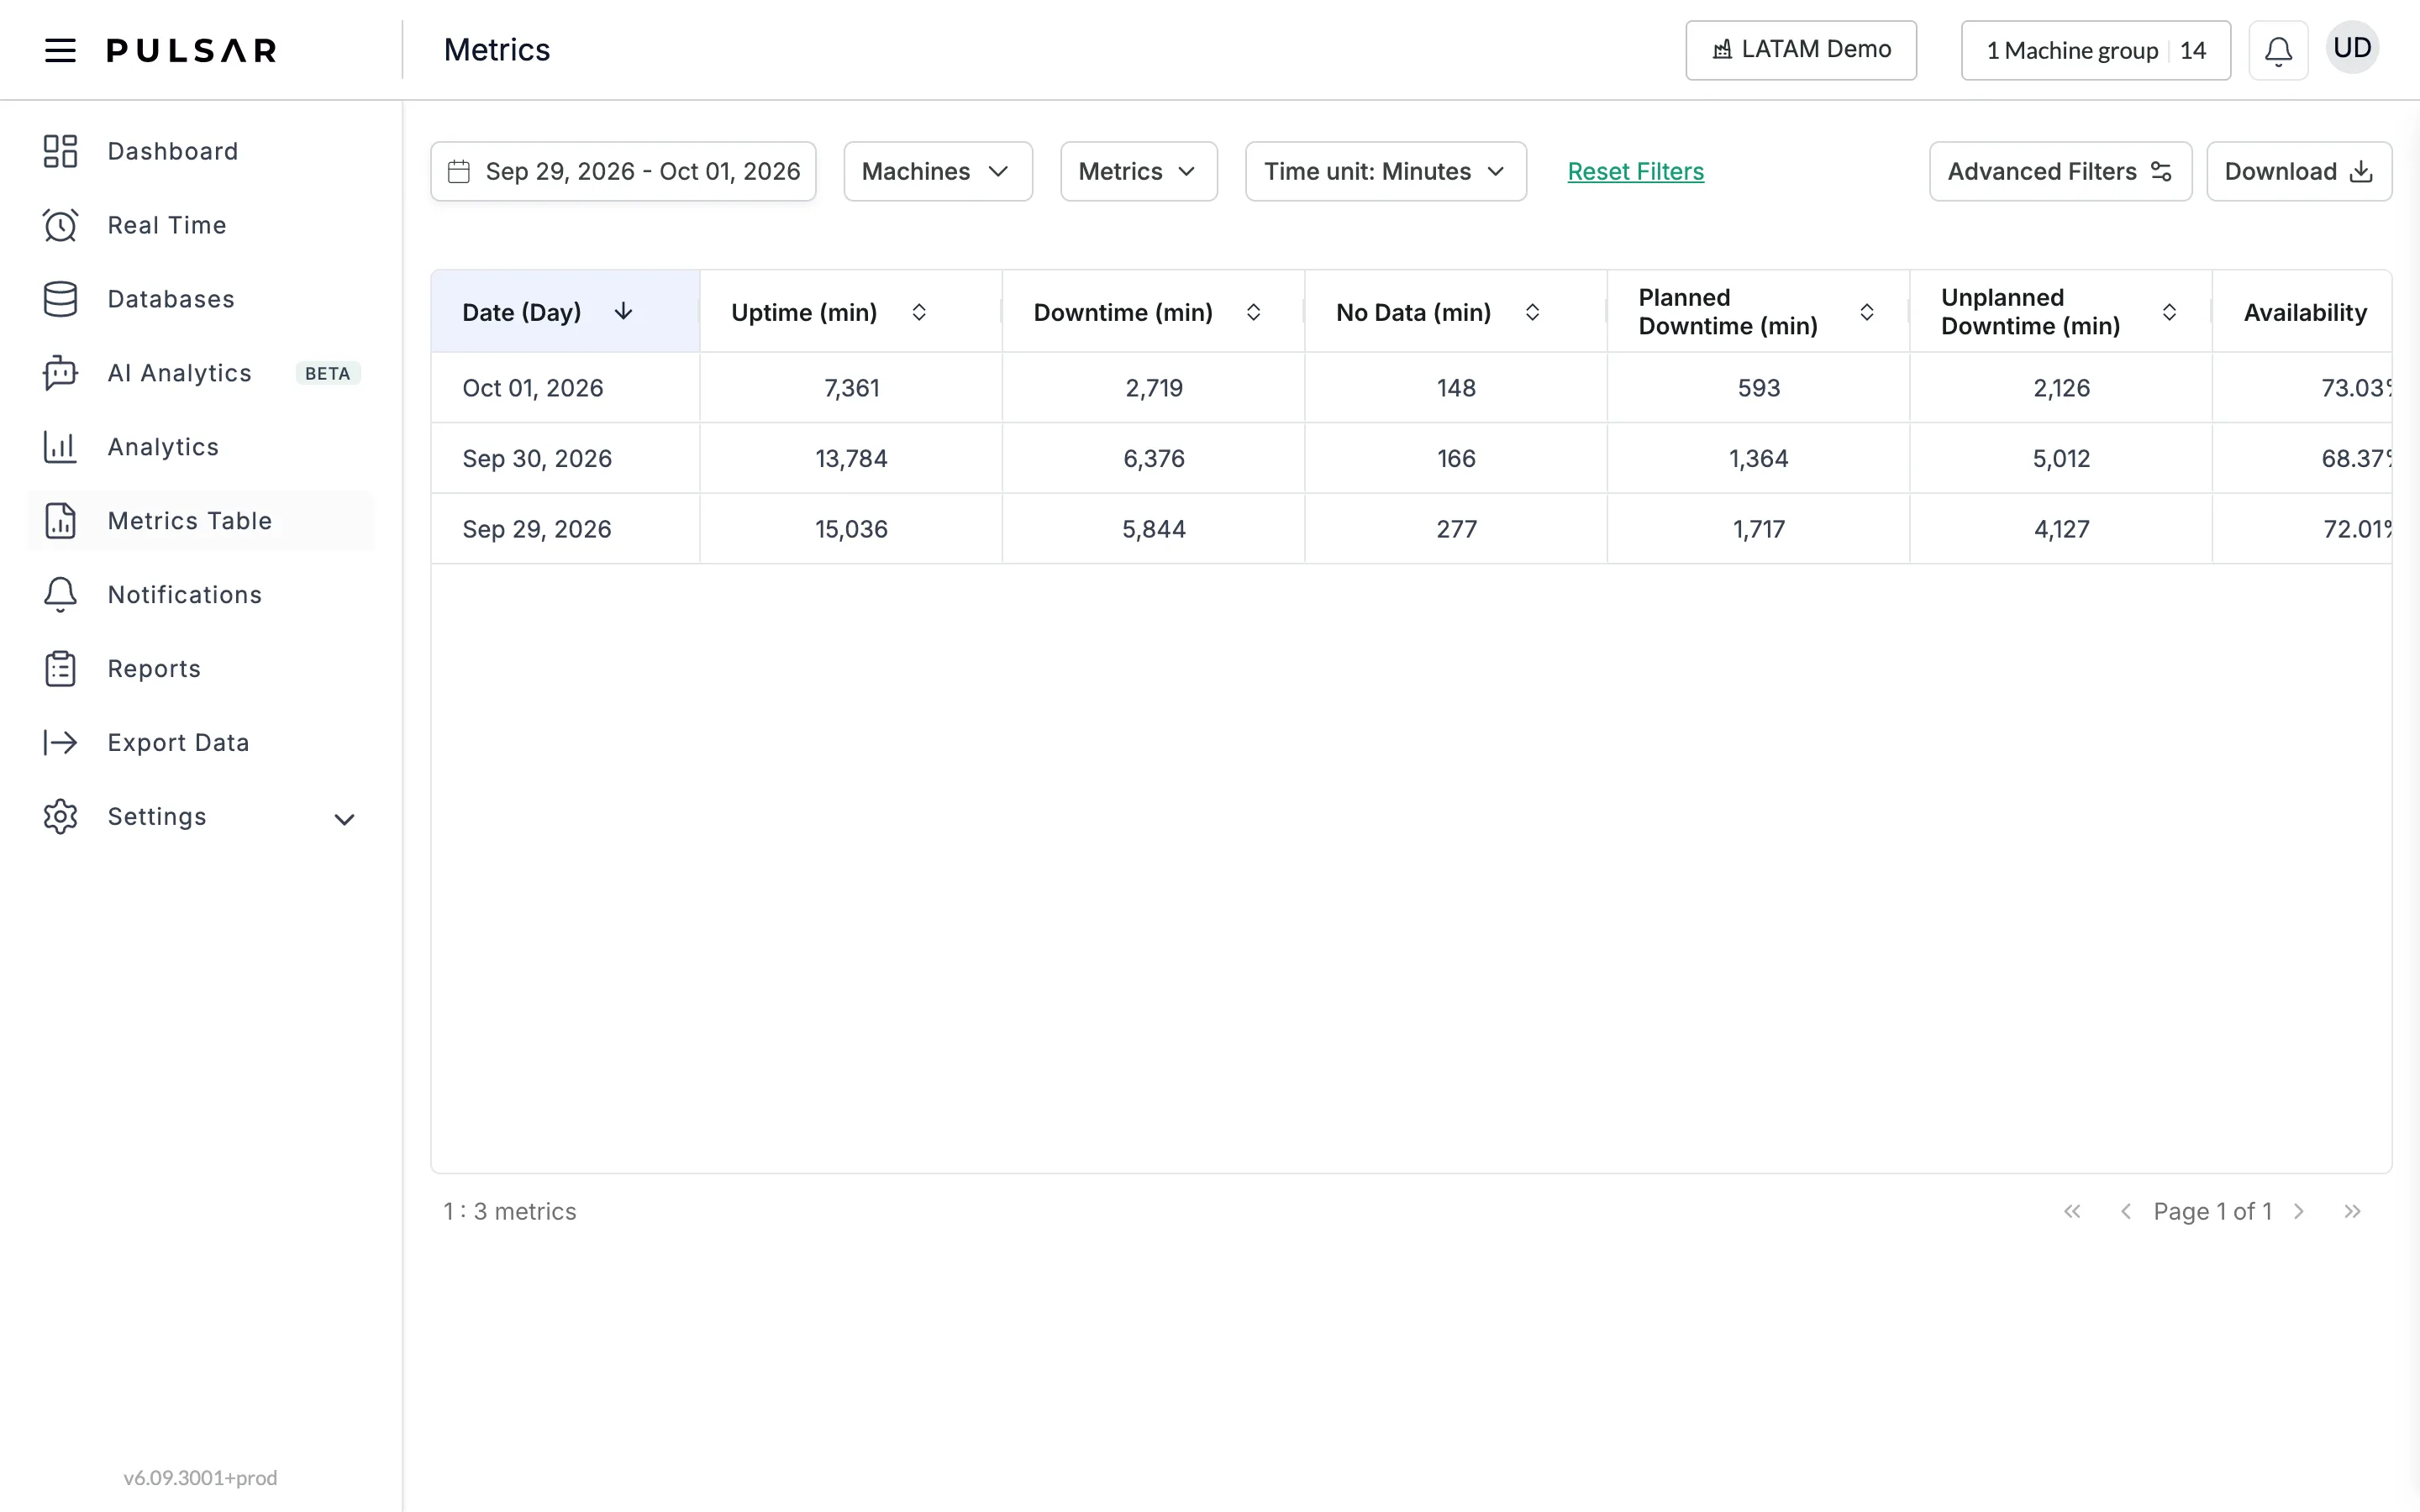
Primary filters
At the top of the page, choose:
- the search date range: pick the days in the calendar or use Today, Yesterday, This Week, Last Week, This Month or Last Month, then click Apply,
- the Machines,
- the Metrics you want to see as columns: turn each one on or off, or use Hide all and Show all,
- the Time unit for the time columns: Minutes or Hours, then click Apply.
Click Reset Filters to clear them.
Advanced filters
Click Advanced Filters at the top right of the table. It shows two sections.
Other filters
Other Filters complement the primary ones and help you split the information in the table: SKU, Operators and Shifts.
Show by
Show By sets how the table groups its rows:
- Dimensions: turn on Machine, SKU, Operator or Shift Title to add that dimension as a column. Hide all and Show all switch them all at once.
- Period: group the rows by Shift, Day, Week or Month, then click Apply.
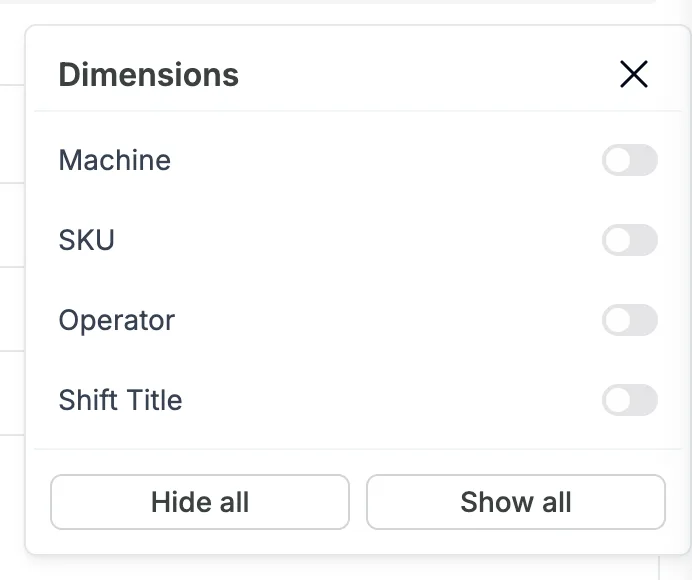
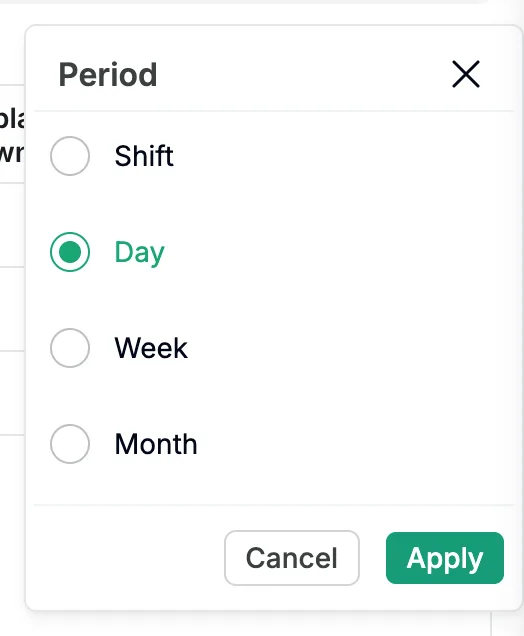
For example, with the SKU dimension turned on and the period set to Day, the table shows one row for each SKU on each day:
Download the table
Click Download at the top right to download the table as it is shown, with your filters and columns, as a .csv file.
If you have trouble with the Metrics Table or need help, contact your Customer Success representative or raise a support ticket from the app.