Real time and TV view
Classify stops, set the operator, SKU and defects, choose metrics, set up the TV version and review past shifts from the Real Time page.
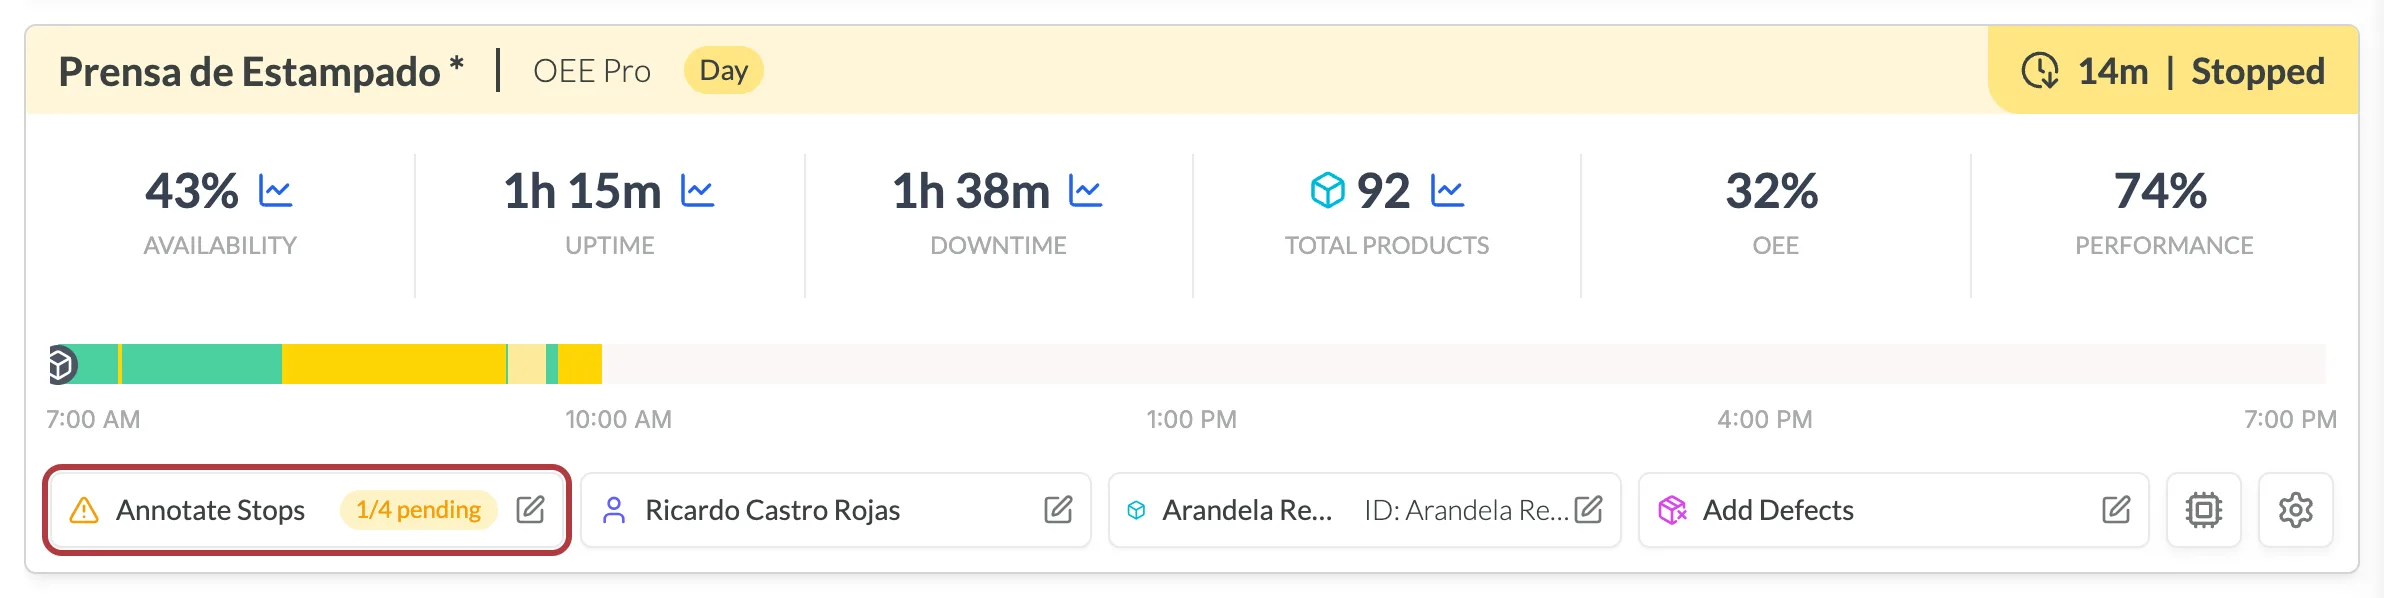
The Real Time page shows every machine's live status, metrics and shift timeline, and lets you enter what the machine data can't tell Pulsar on its own. At the top, counters show how many machines are producing, stopped, in alert, without data or out of shift.
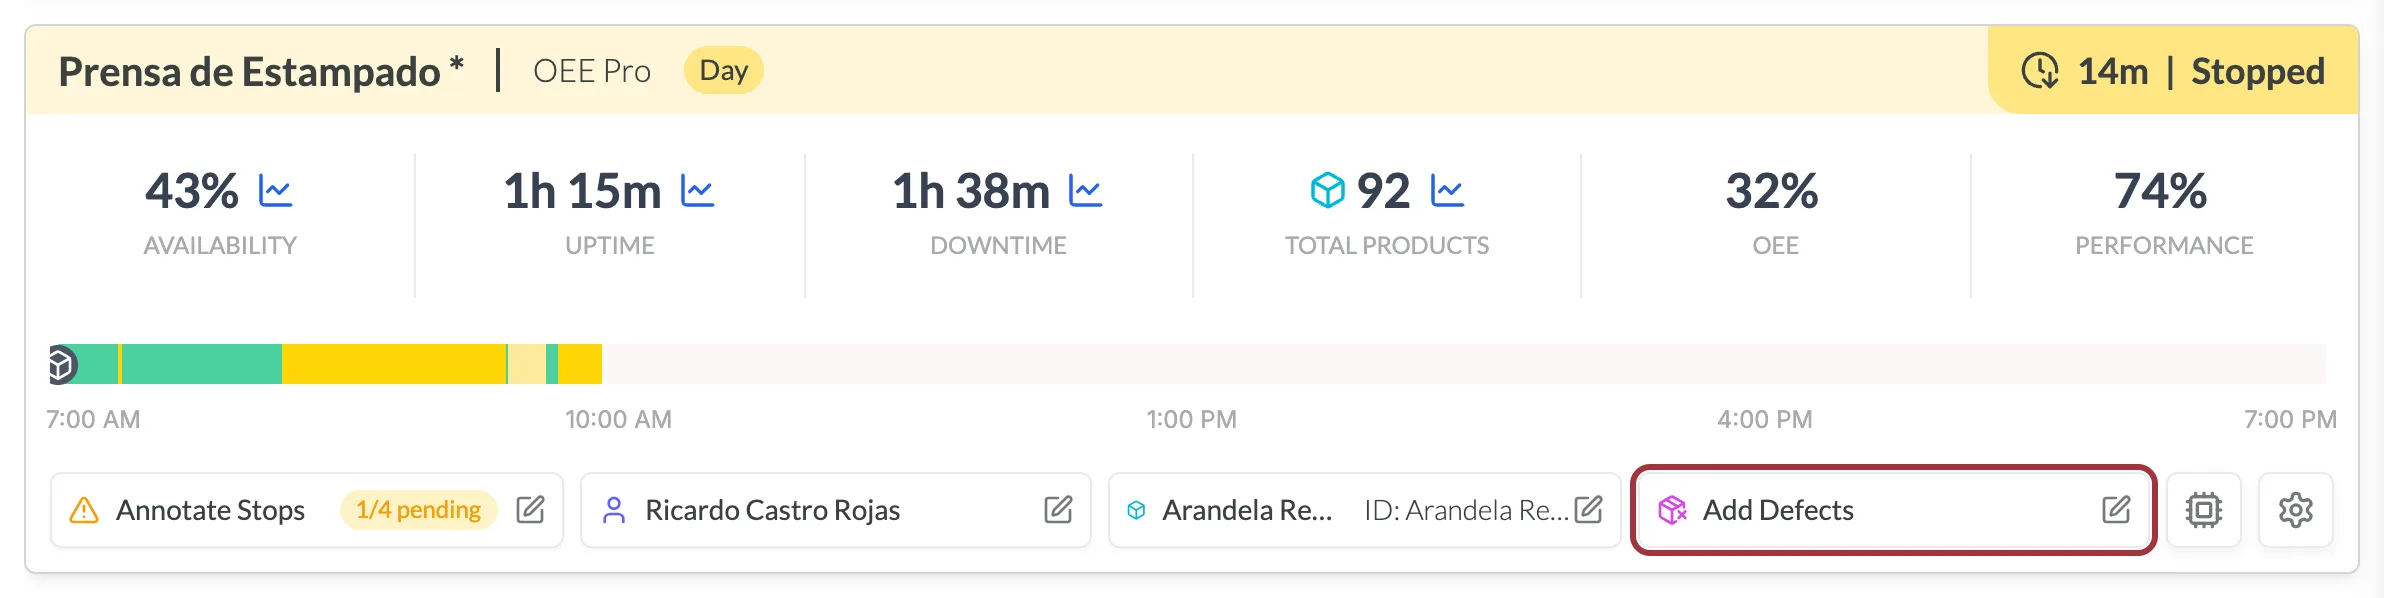
Each machine's card has a row of buttons below its timeline: one for stops, one for the operator, one for the SKU, one for defects, and two icons at the right end, Hardware status and the gear for the machine's settings. Which buttons a card shows depends on what your account has for that machine.
Filter and sort the machines
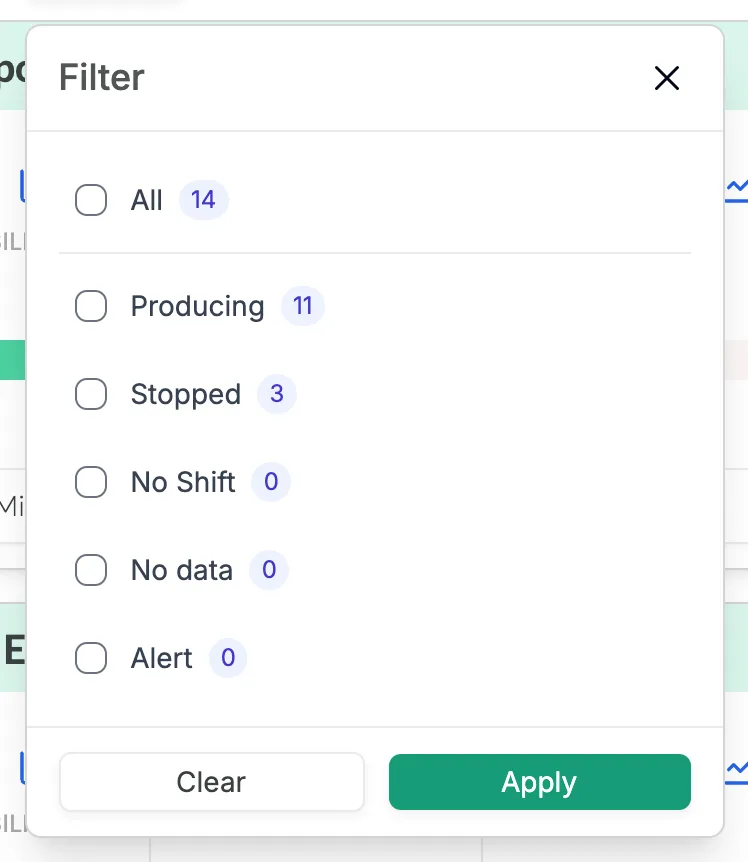
- Filter shows only the machines in the statuses you tick: All, Producing, Stopped, No Shift, No data or Alert, each with how many machines are in it. Click Apply, or Clear to show them all again.
- Sort by orders the cards by Machine Name (A → Z), Machine Name (Z → A) or Defined by Admin. To customize the admin-defined order, contact your Customer Success representative.
- Quick Tour, at the top right, walks you through the page step by step.
Classify stops
- On the machine's card, click the stops button. When the shift has unclassified stops, it reads Annotate Stops with a count such as 1/15 pending. Otherwise it shows the general and specific cause of the latest stop.
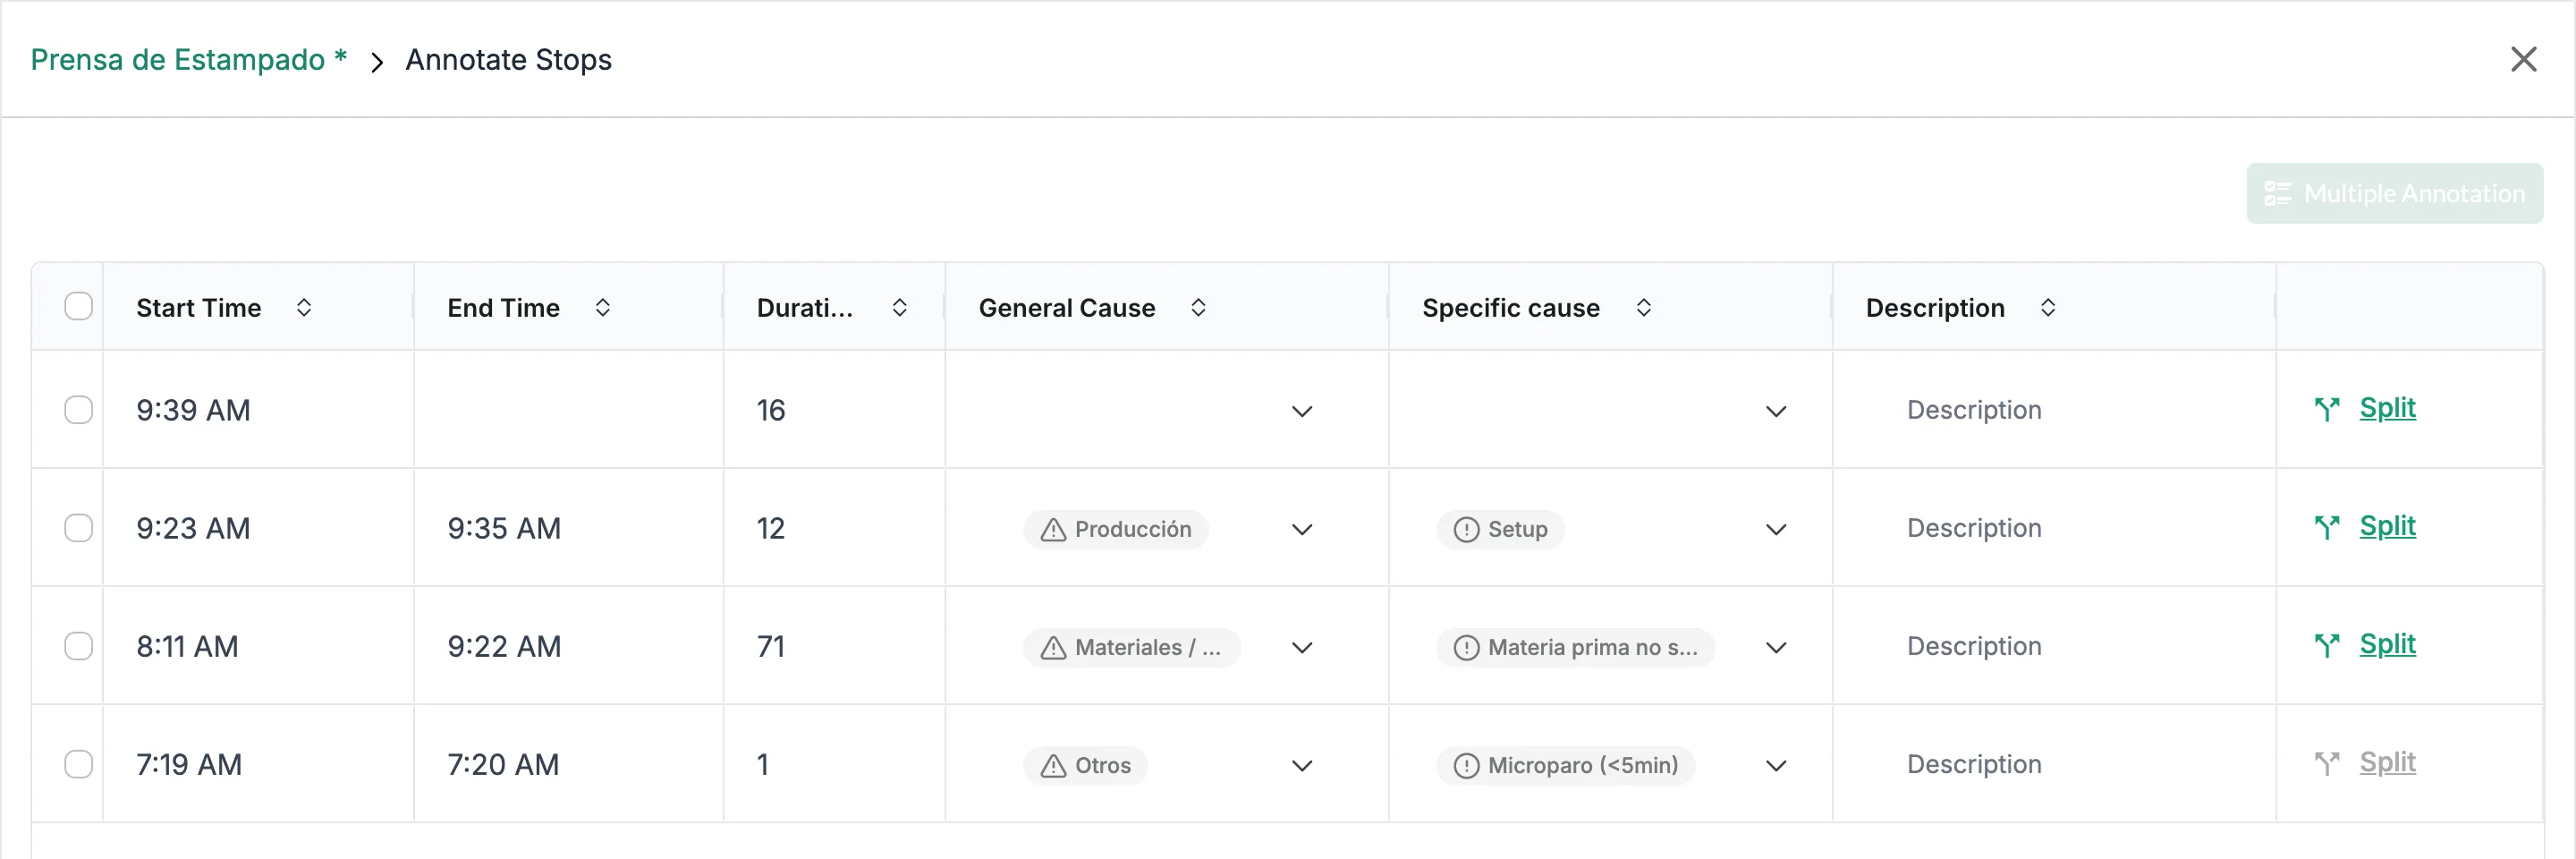
- The Annotate Stops window opens over the whole page, with the shift's stops: Start Time, End Time, Duration, General Cause, Specific cause and Description. For each stop, choose the General Cause and Specific cause from their lists (you can type to search) and type a Description if you need one.
- When you're done, close the window with the X at the top right.
There's no Save button: the classification is recorded as you choose it.
From the same window you can also:
- Split a stop with its Split link. In the Split Stop dialog, click + to add the time where the stop splits, then Confirm. Split is greyed out on very short stops.
- Classify several stops at once: select at least two with their checkboxes, click Multiple Annotation, choose the General Cause, Specific cause, Equipment and Description, and click Confirm.
For more on classifying, splitting and exporting stops, see Stops.
Select the operator
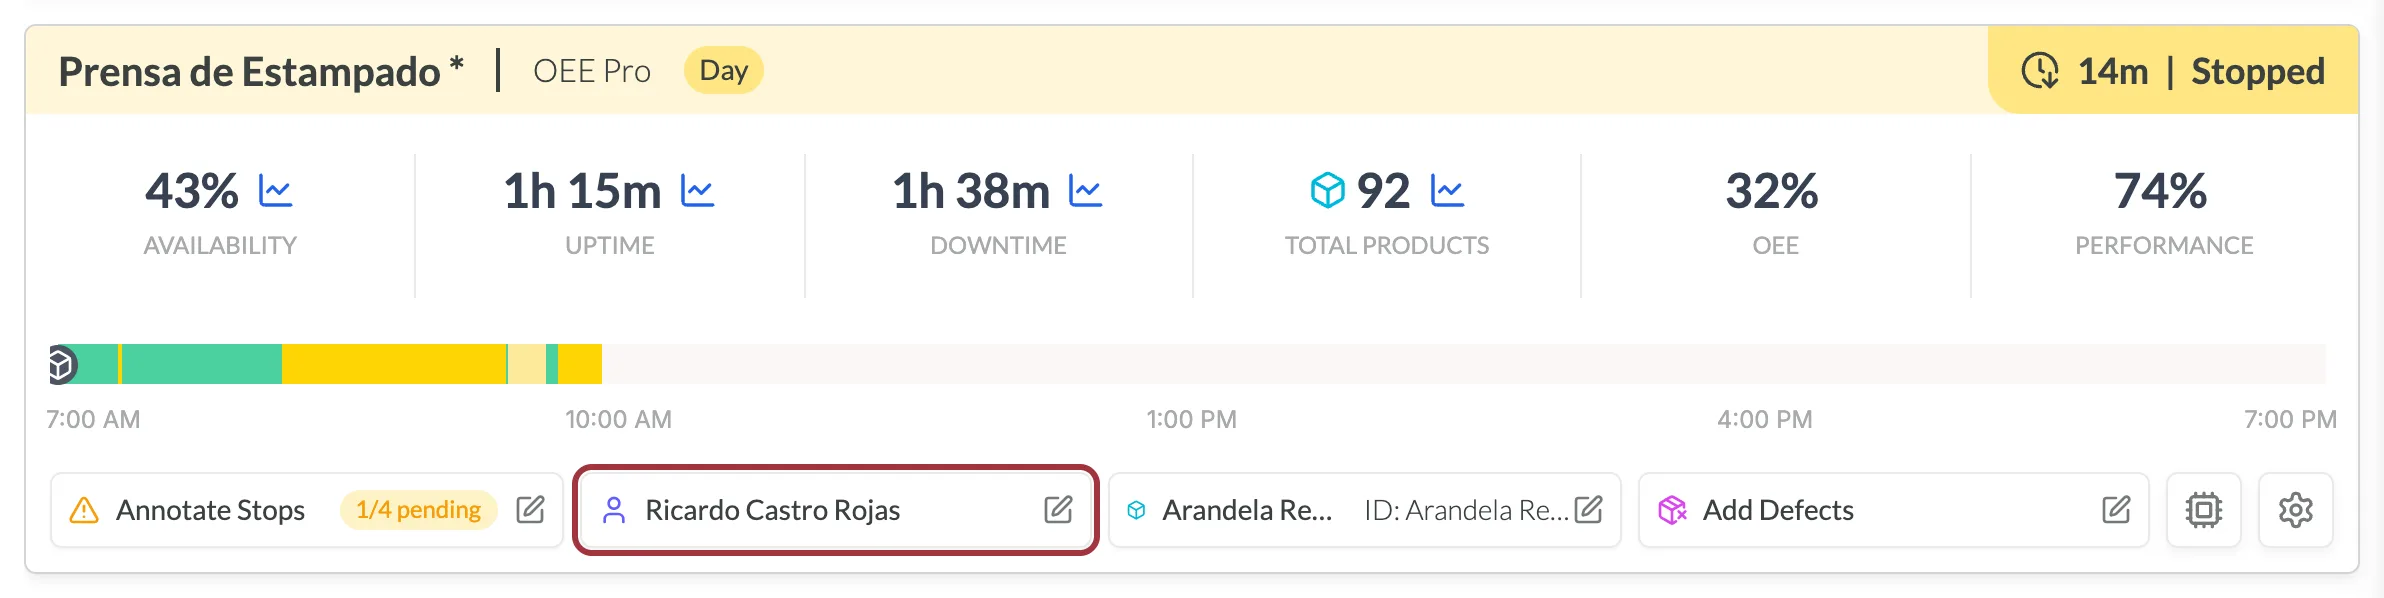
- On the machine's card, click the operator button. It reads Add Operator if nobody is set yet, or shows the current operator's name.
- In Add Operator, choose the Operator. If the machine already had an operator in this shift, also enter the new operator's Start Time (shown in your plant's time zone).
- Click Confirm.
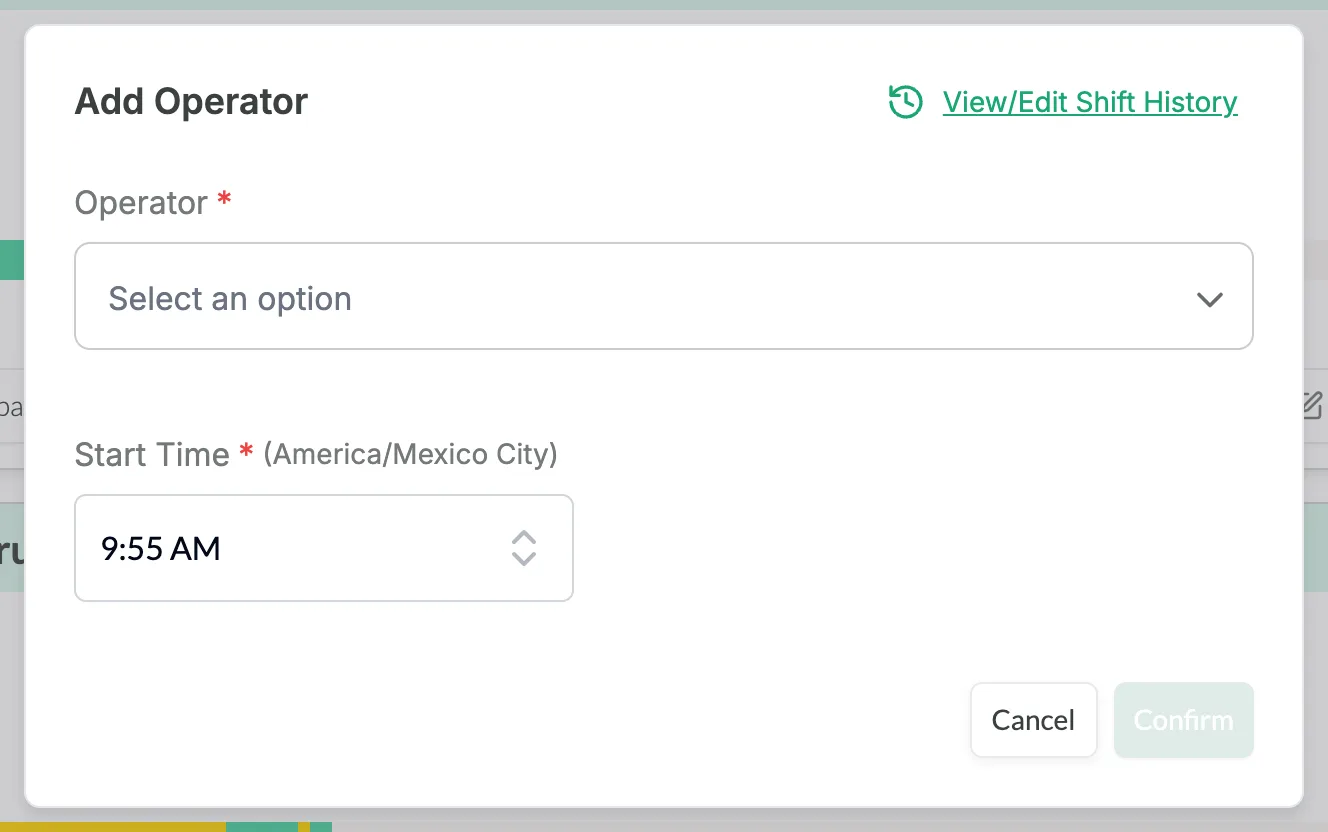
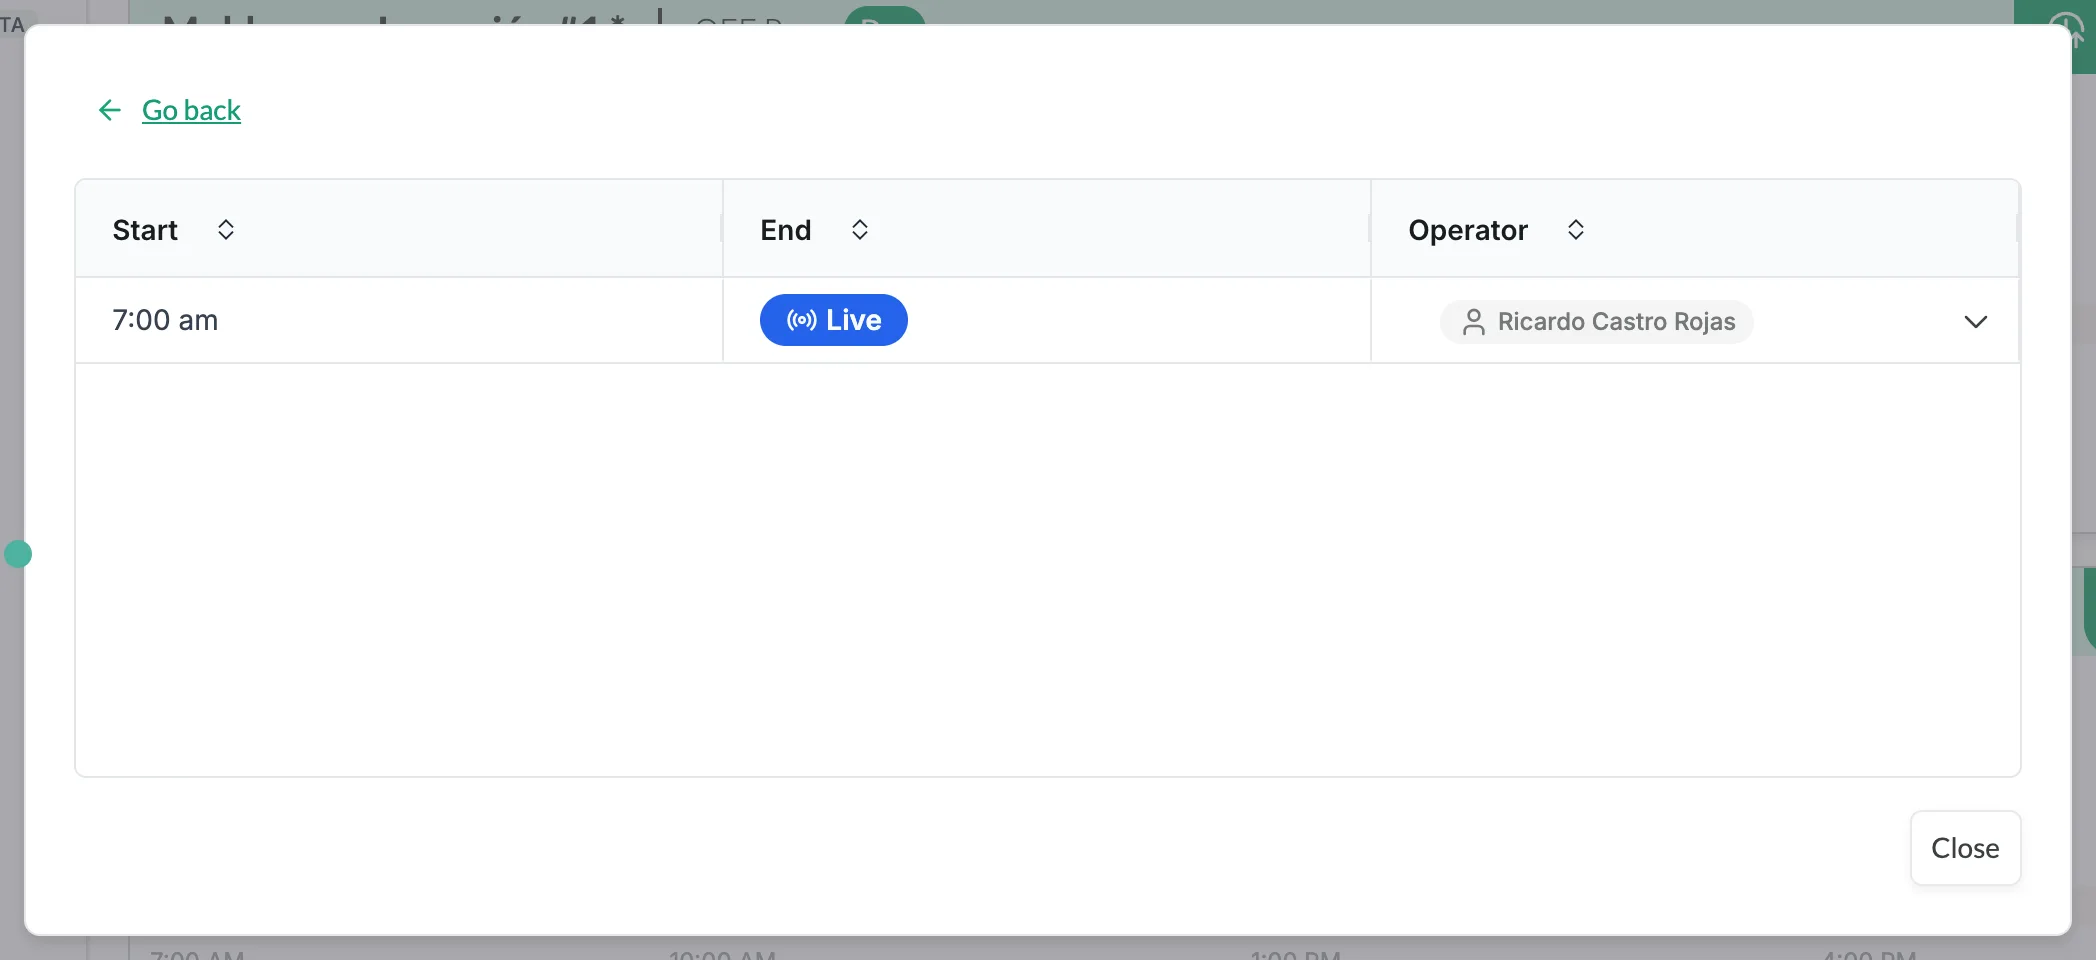
Click View/Edit Shift History to see every operator who has worked on the machine during the current shift, and change one from its list if needed. Go back returns to the dialog and Close closes it.
Select the SKU
- On the machine's card, click the SKU button. It reads Add SKU if no SKU is set yet, or shows the current SKU and its ID.
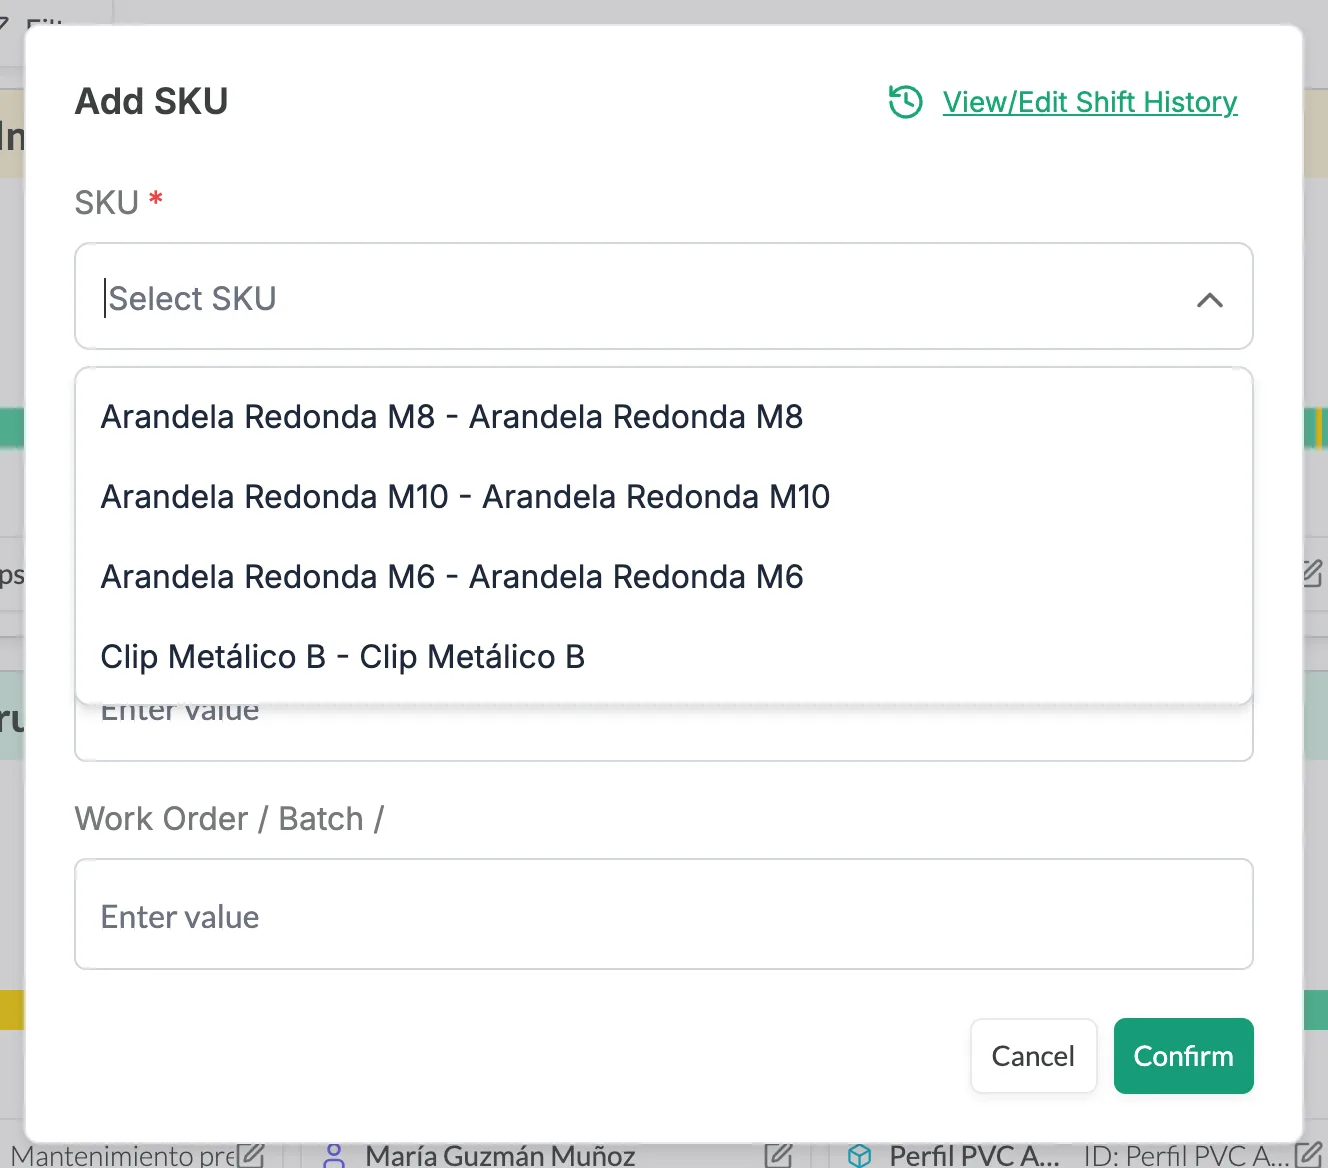
- In Add SKU, choose the SKU. The list shows each SKU's code and name, and you can type to search. If the machine already had a SKU in this shift, also enter its Start Time.
- Fill in any extra fields your account uses, such as Supervisor or Work Order / Batch /.
- Click Confirm.
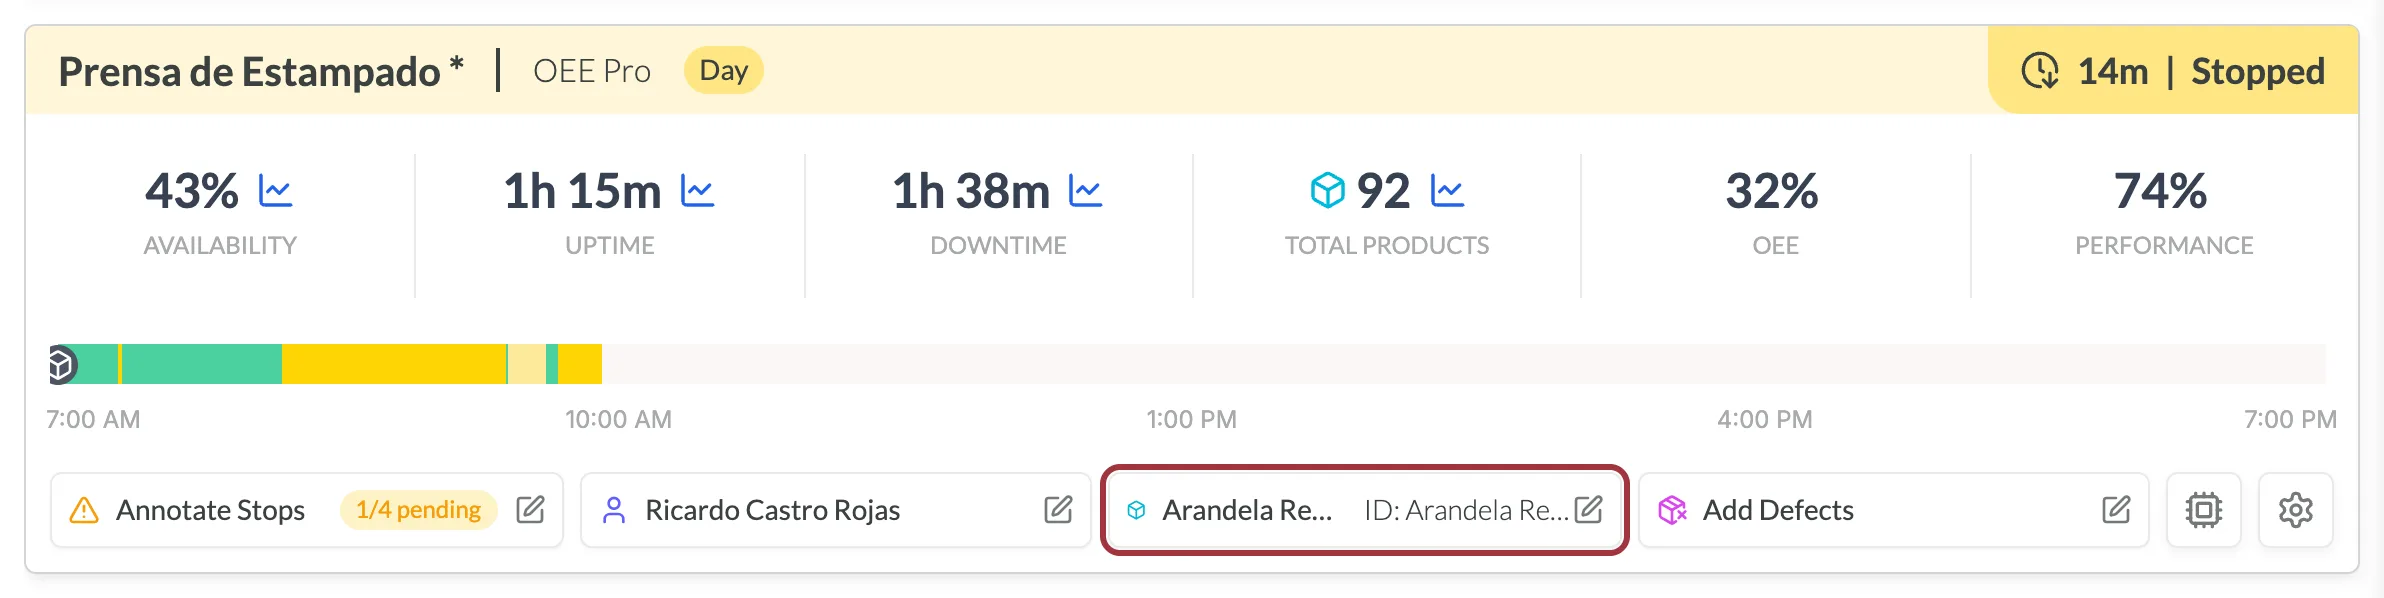
The SKU button is only available for machines with production tracked by a counting sensor.
- If you don't have production, this option isn't available. Contact your Customer Success representative for more information.
- If you have production without a counting sensor, the card has Add Production instead. See Add production on a card.
Add production on a card
On OEE Lite machines, which have production but no counting sensor, the card has an Add Production button instead of the SKU button. Use it to record how much was produced, of which SKU, up to what time.
- On the machine's card, click Add Production.
- Enter the Quantity and choose the SKU, both required.
- Set the End Time, the time up to which that quantity was produced, within the shift. It starts one minute before the current time.
- If your account uses them, choose the Production Order and fill in the extra fields.
- Click Confirm.
The button appears only for users whose role can create production. To do the same on a tablet, see Production Lite.
Add defects
- On the machine's card, click Add Defects.
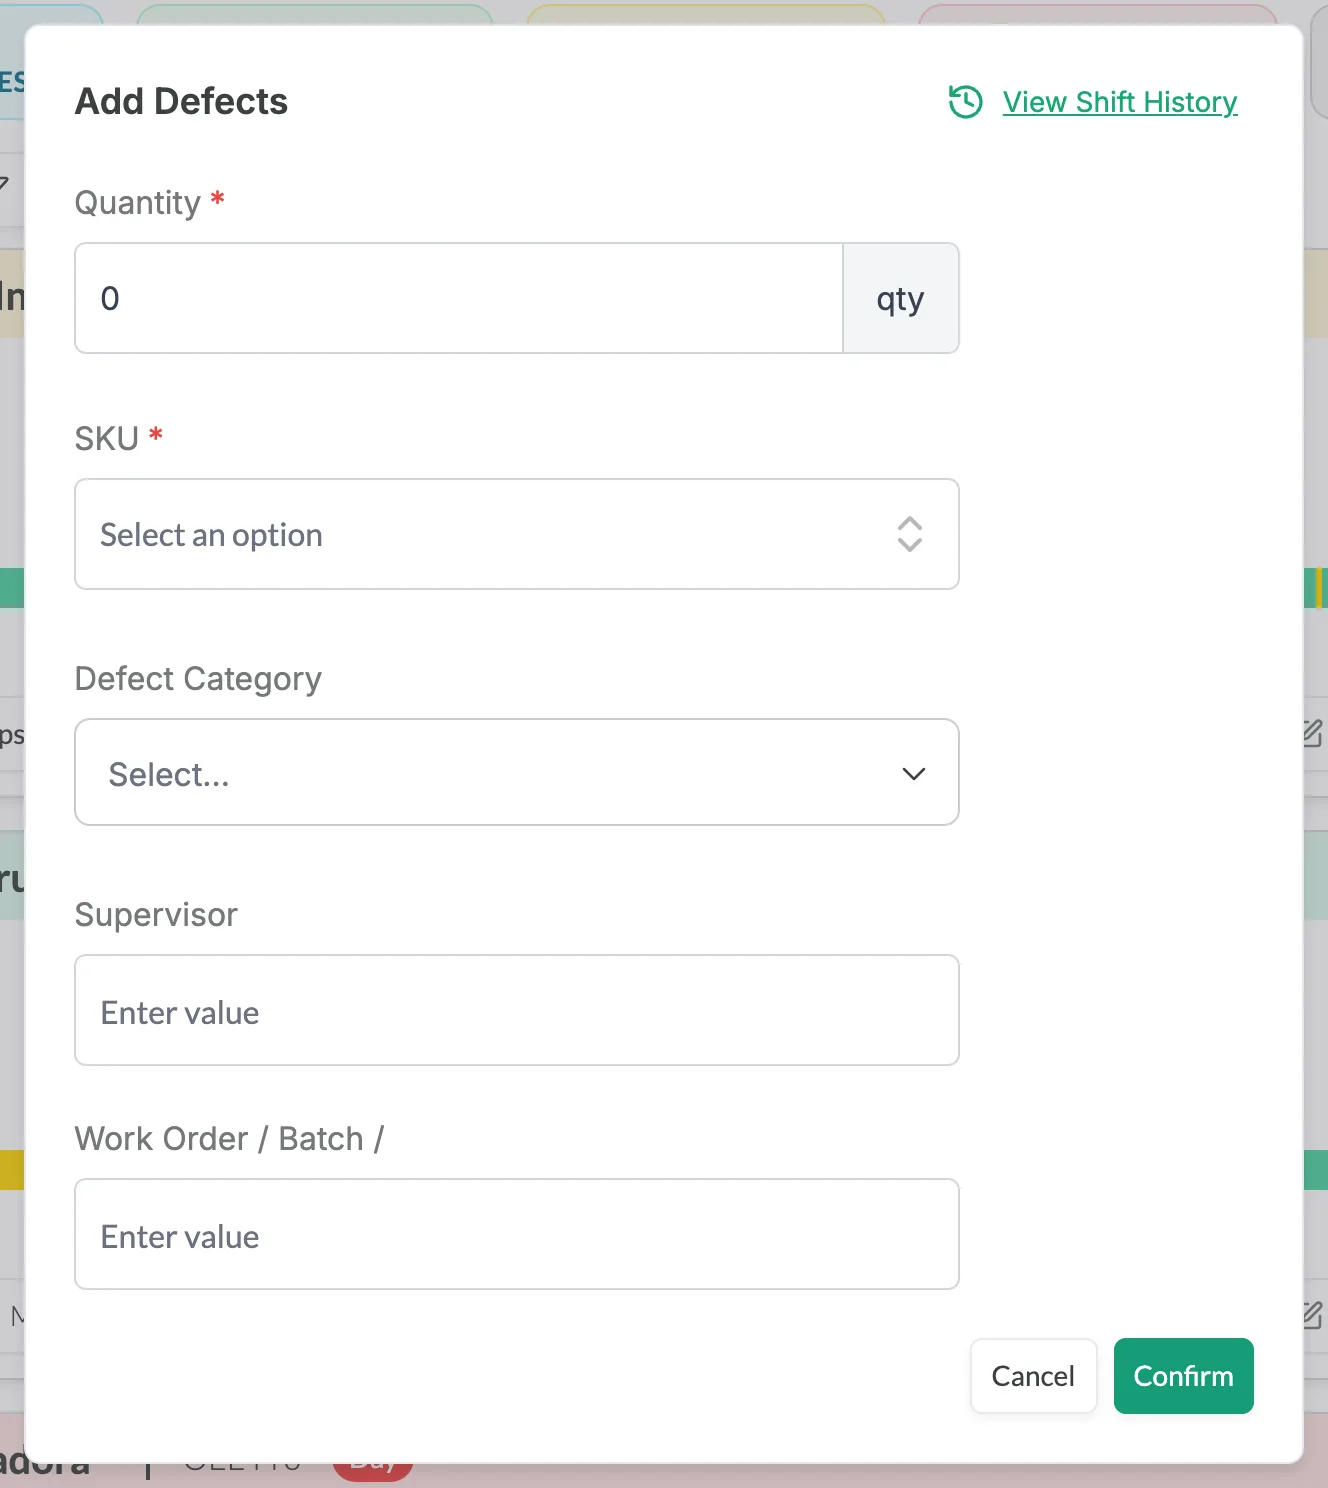
- Enter the Quantity and choose the SKU, both required. Optionally choose the Defect Category and fill in any extra fields your account uses, such as Supervisor or Work Order / Batch /.
- Click Confirm.
View Shift History, at the top right of the dialog, shows what was recorded during the shift.
Add Defects is only available for accounts with the production module. If you don't have production, this option isn't available. Contact your Customer Success representative for more information.
Check the hardware status
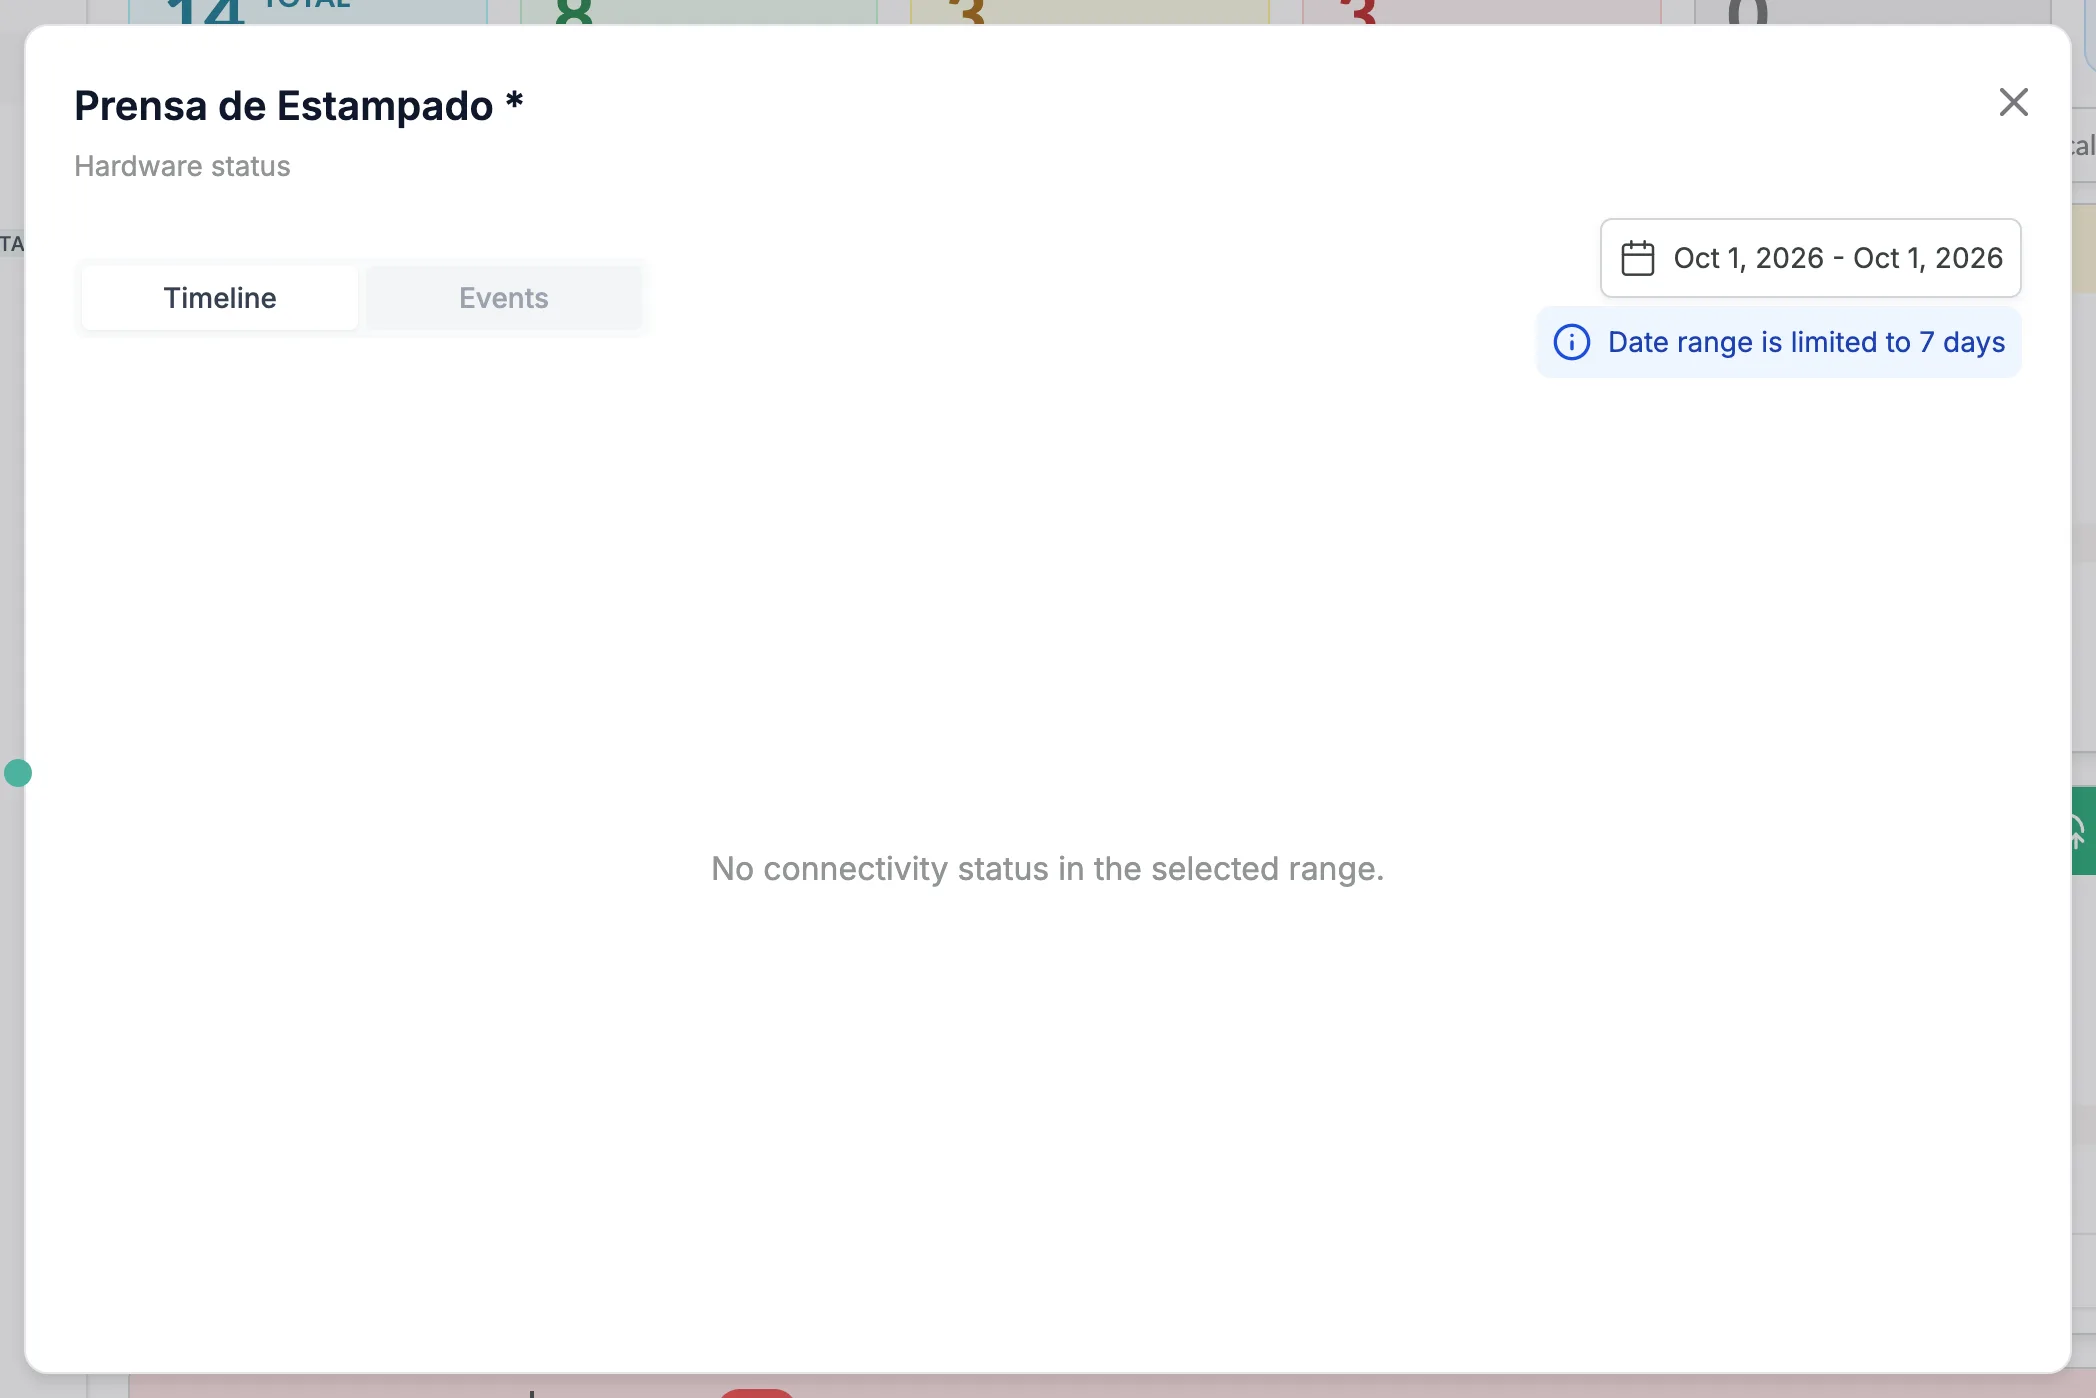
Click the chip icon, Hardware status, at the right end of a card's buttons to see the connectivity of the machine's Pulsar device. The Timeline tab shows its connectivity status and Events lists its events, for a date range of up to 7 days. See Hardware status for what each state means.
Choose the metrics
You can choose which metrics each machine shows in Real Time and in the TV Version, and they can be different for each machine:
- up to 7 metrics per machine in Real Time
- up to 4 metrics per machine in the TV Version, or fewer in the larger Tower Control layouts (see TV mode)
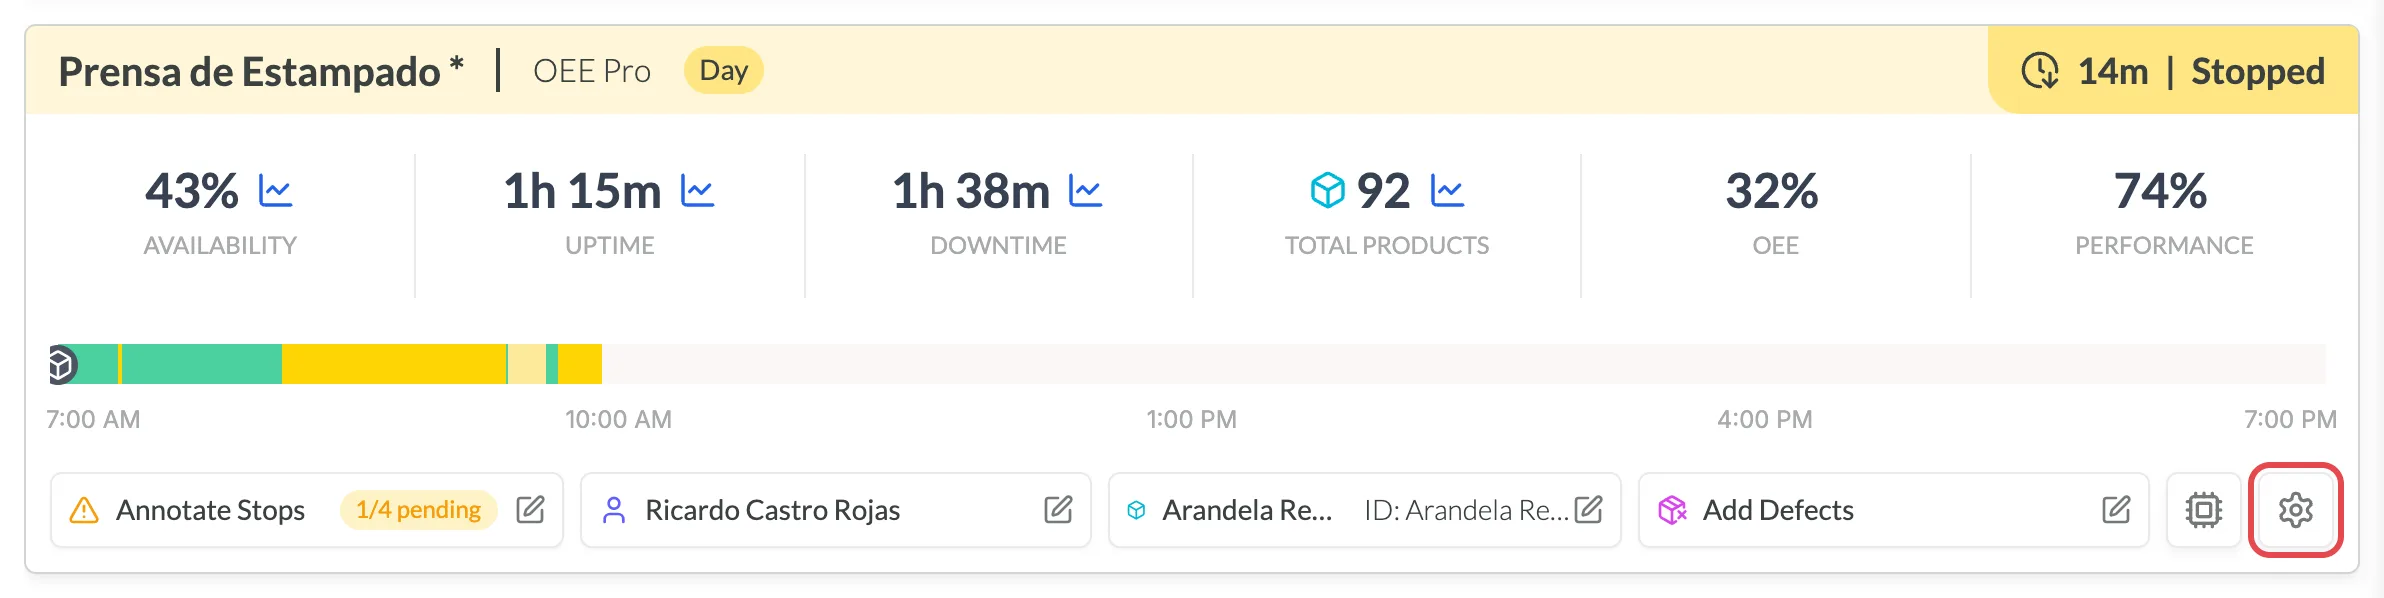
On a machine's card, click the gear icon at the right end of the buttons. You can also open Settings → Real Time in the menu.
Real Time Settings opens on Settings (For you) and Standard View. In step 1, Select machines, choose the machines to set up. Use Company Default Metrics fills them with your company's defaults.
In step 2, Configure metrics per machine, click Add metric to add one, the × on a metric to remove it, and drag the metrics to reorder them. Their colours show each metric's category: Time, Availability, Products, Performance, Quality, OEE or Other.
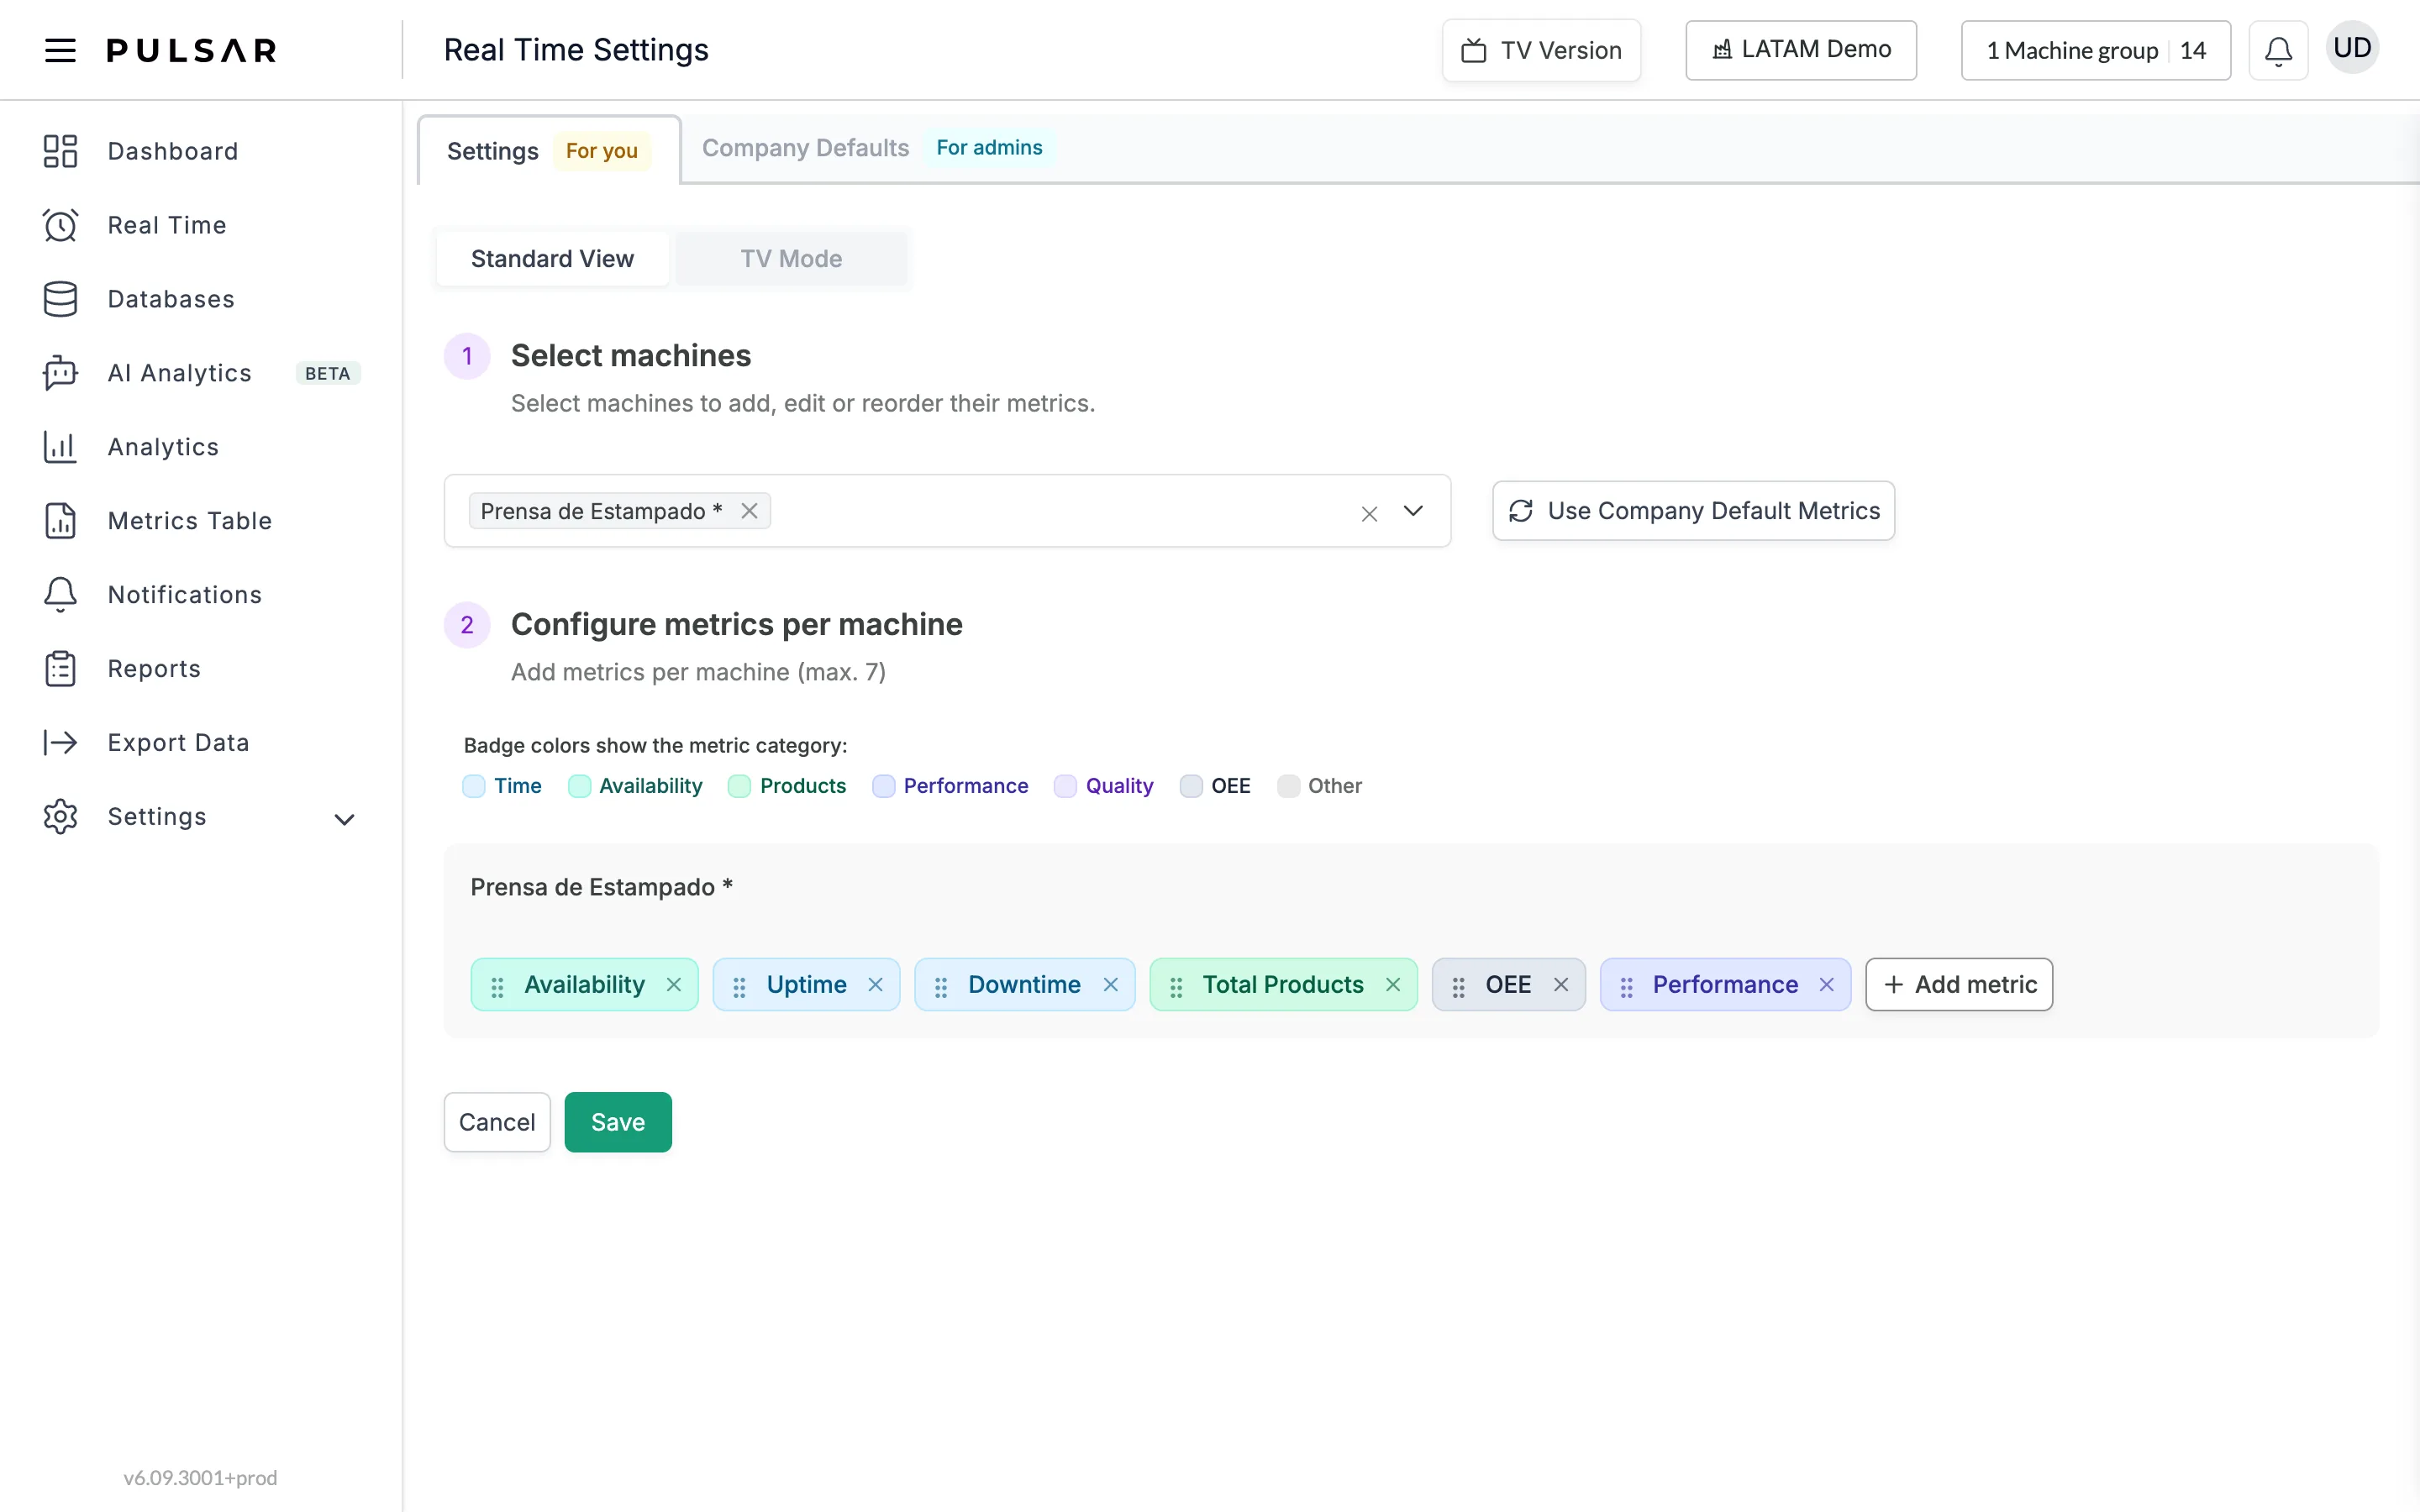
Click Save.
Apply metrics for the whole company
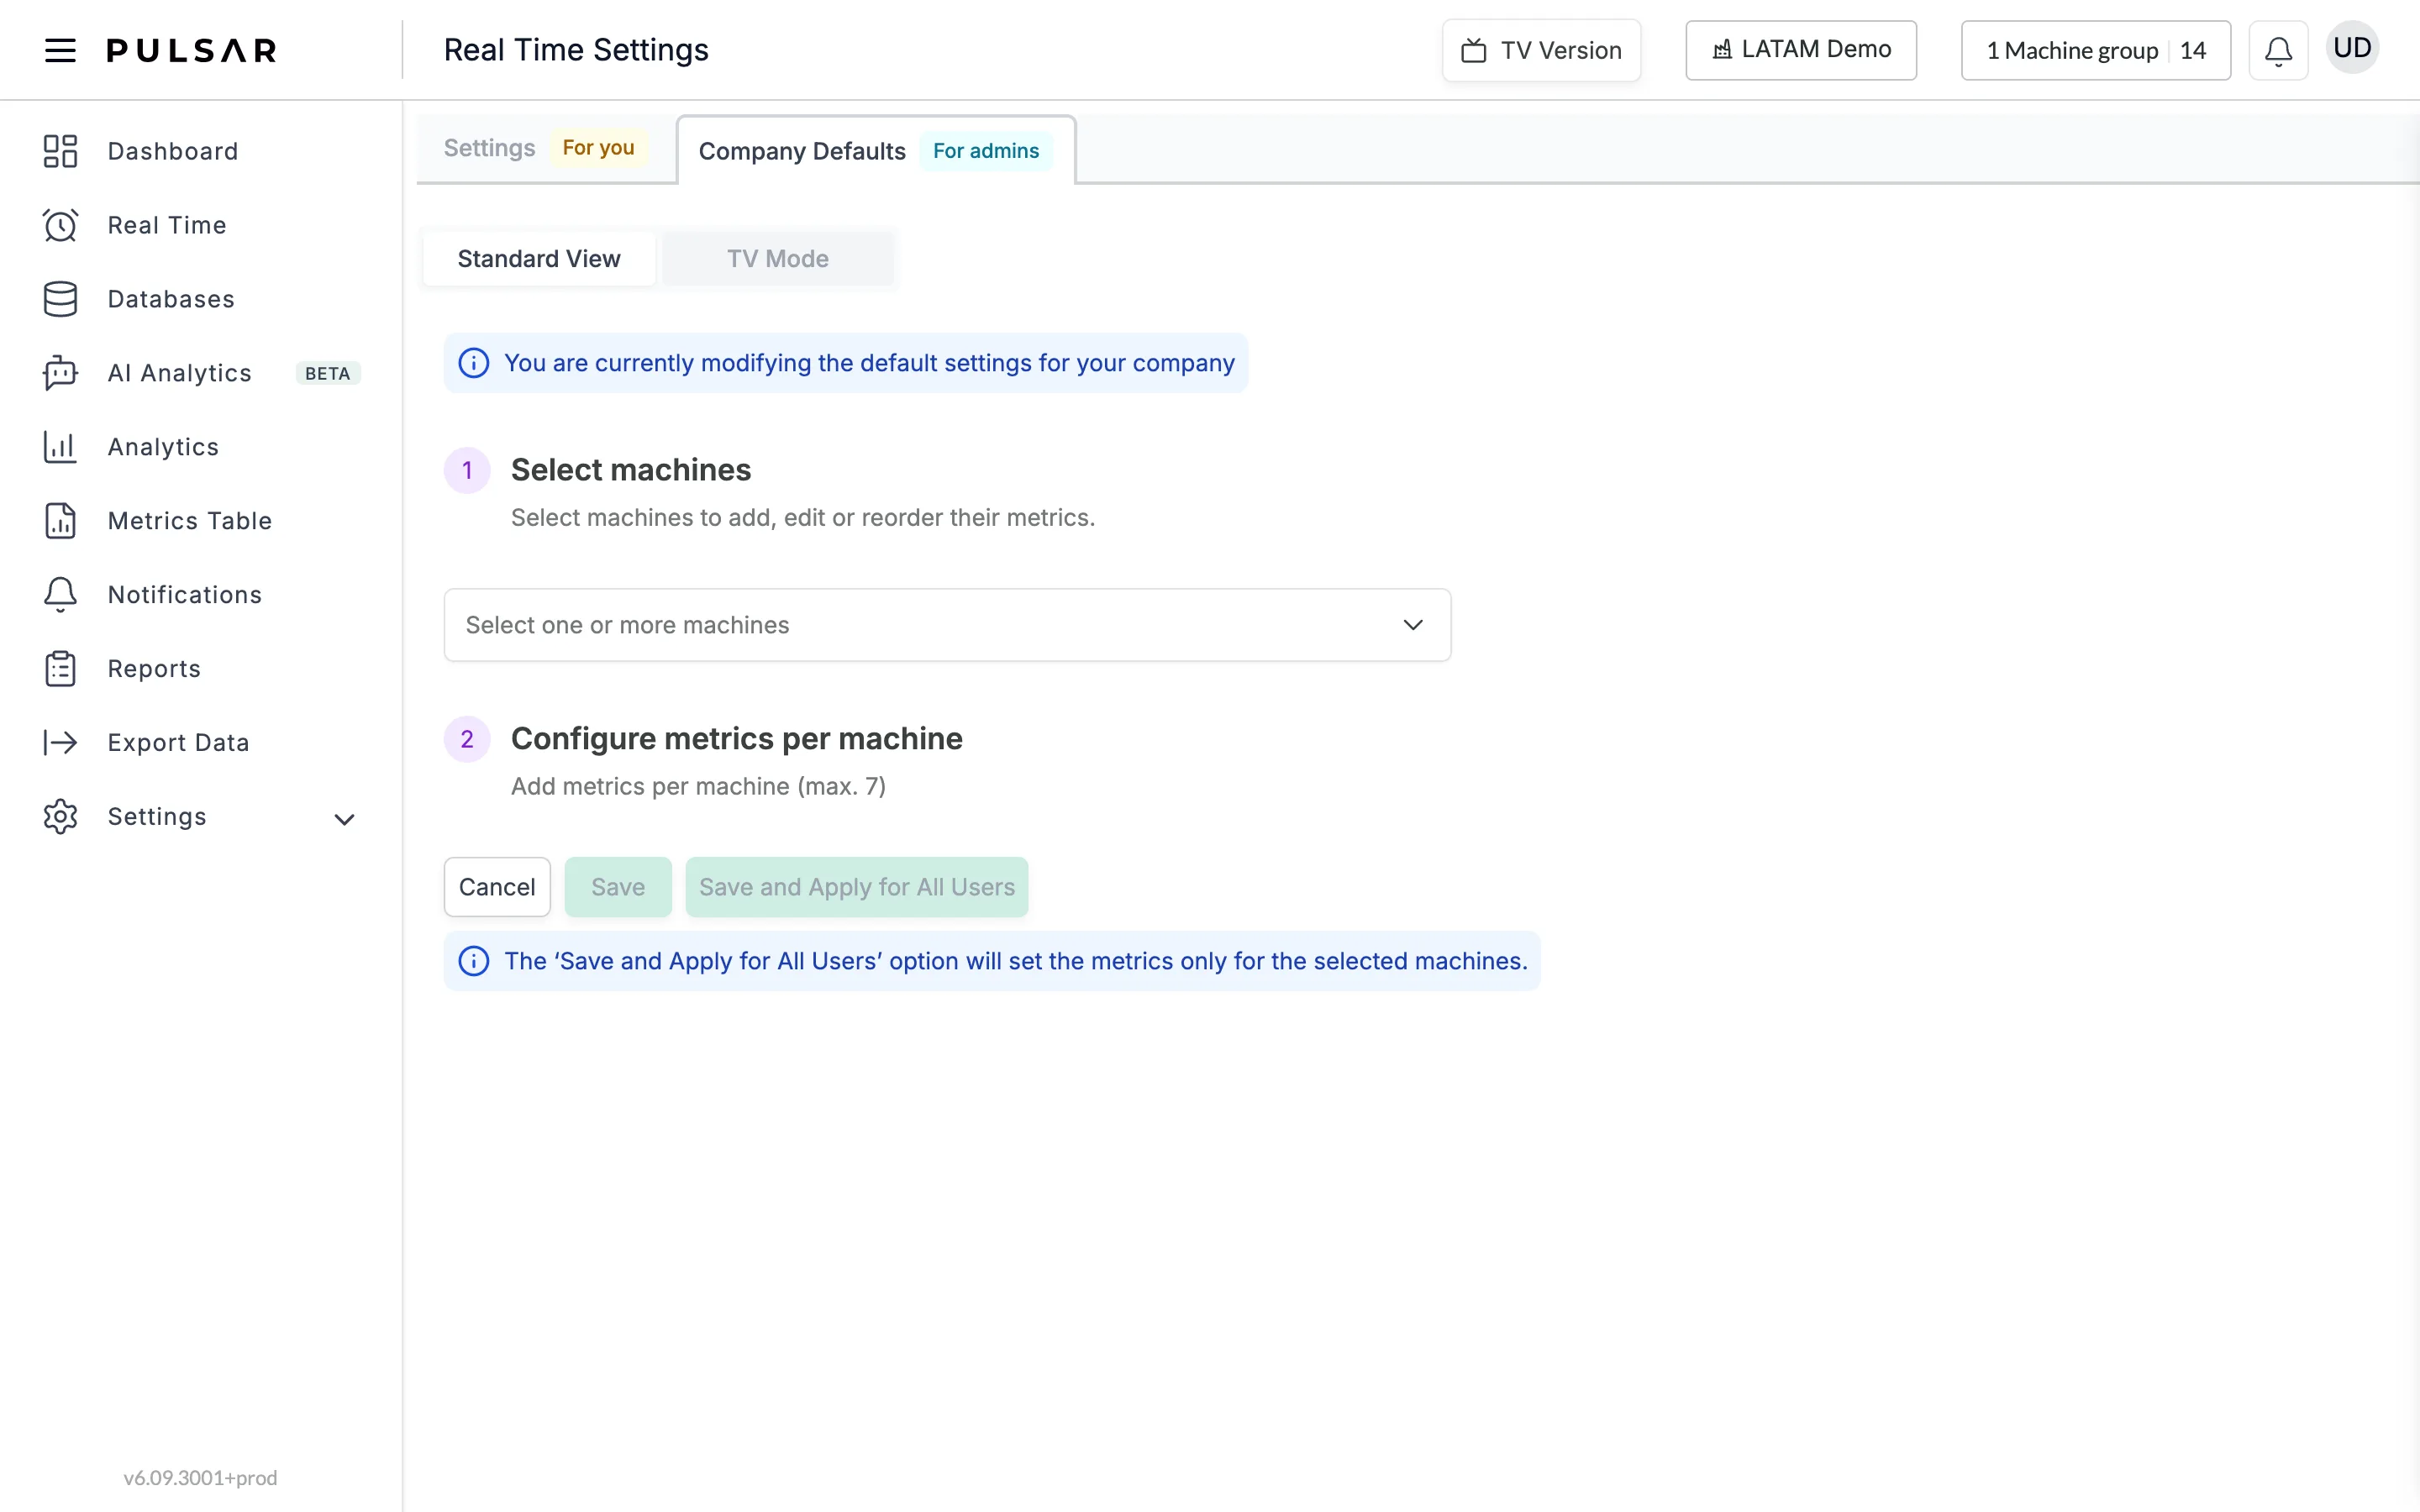
If you're a Pulsar administrator, you can apply these settings to your whole organization so every user sees the same metrics. Open the Company Defaults tab (For admins), follow step 1, Select machines, and step 2, Configure metrics per machine, then click Save and Apply for All Users. This sets the metrics only for the machines you selected.
TV version
Click TV Version, at the top of the page, to show your machines full screen, for example on a plant TV. The slides change on their own, with the date and time and the slide number at the bottom. To leave it, use your browser's back button. Remember that administrators also define its layout.

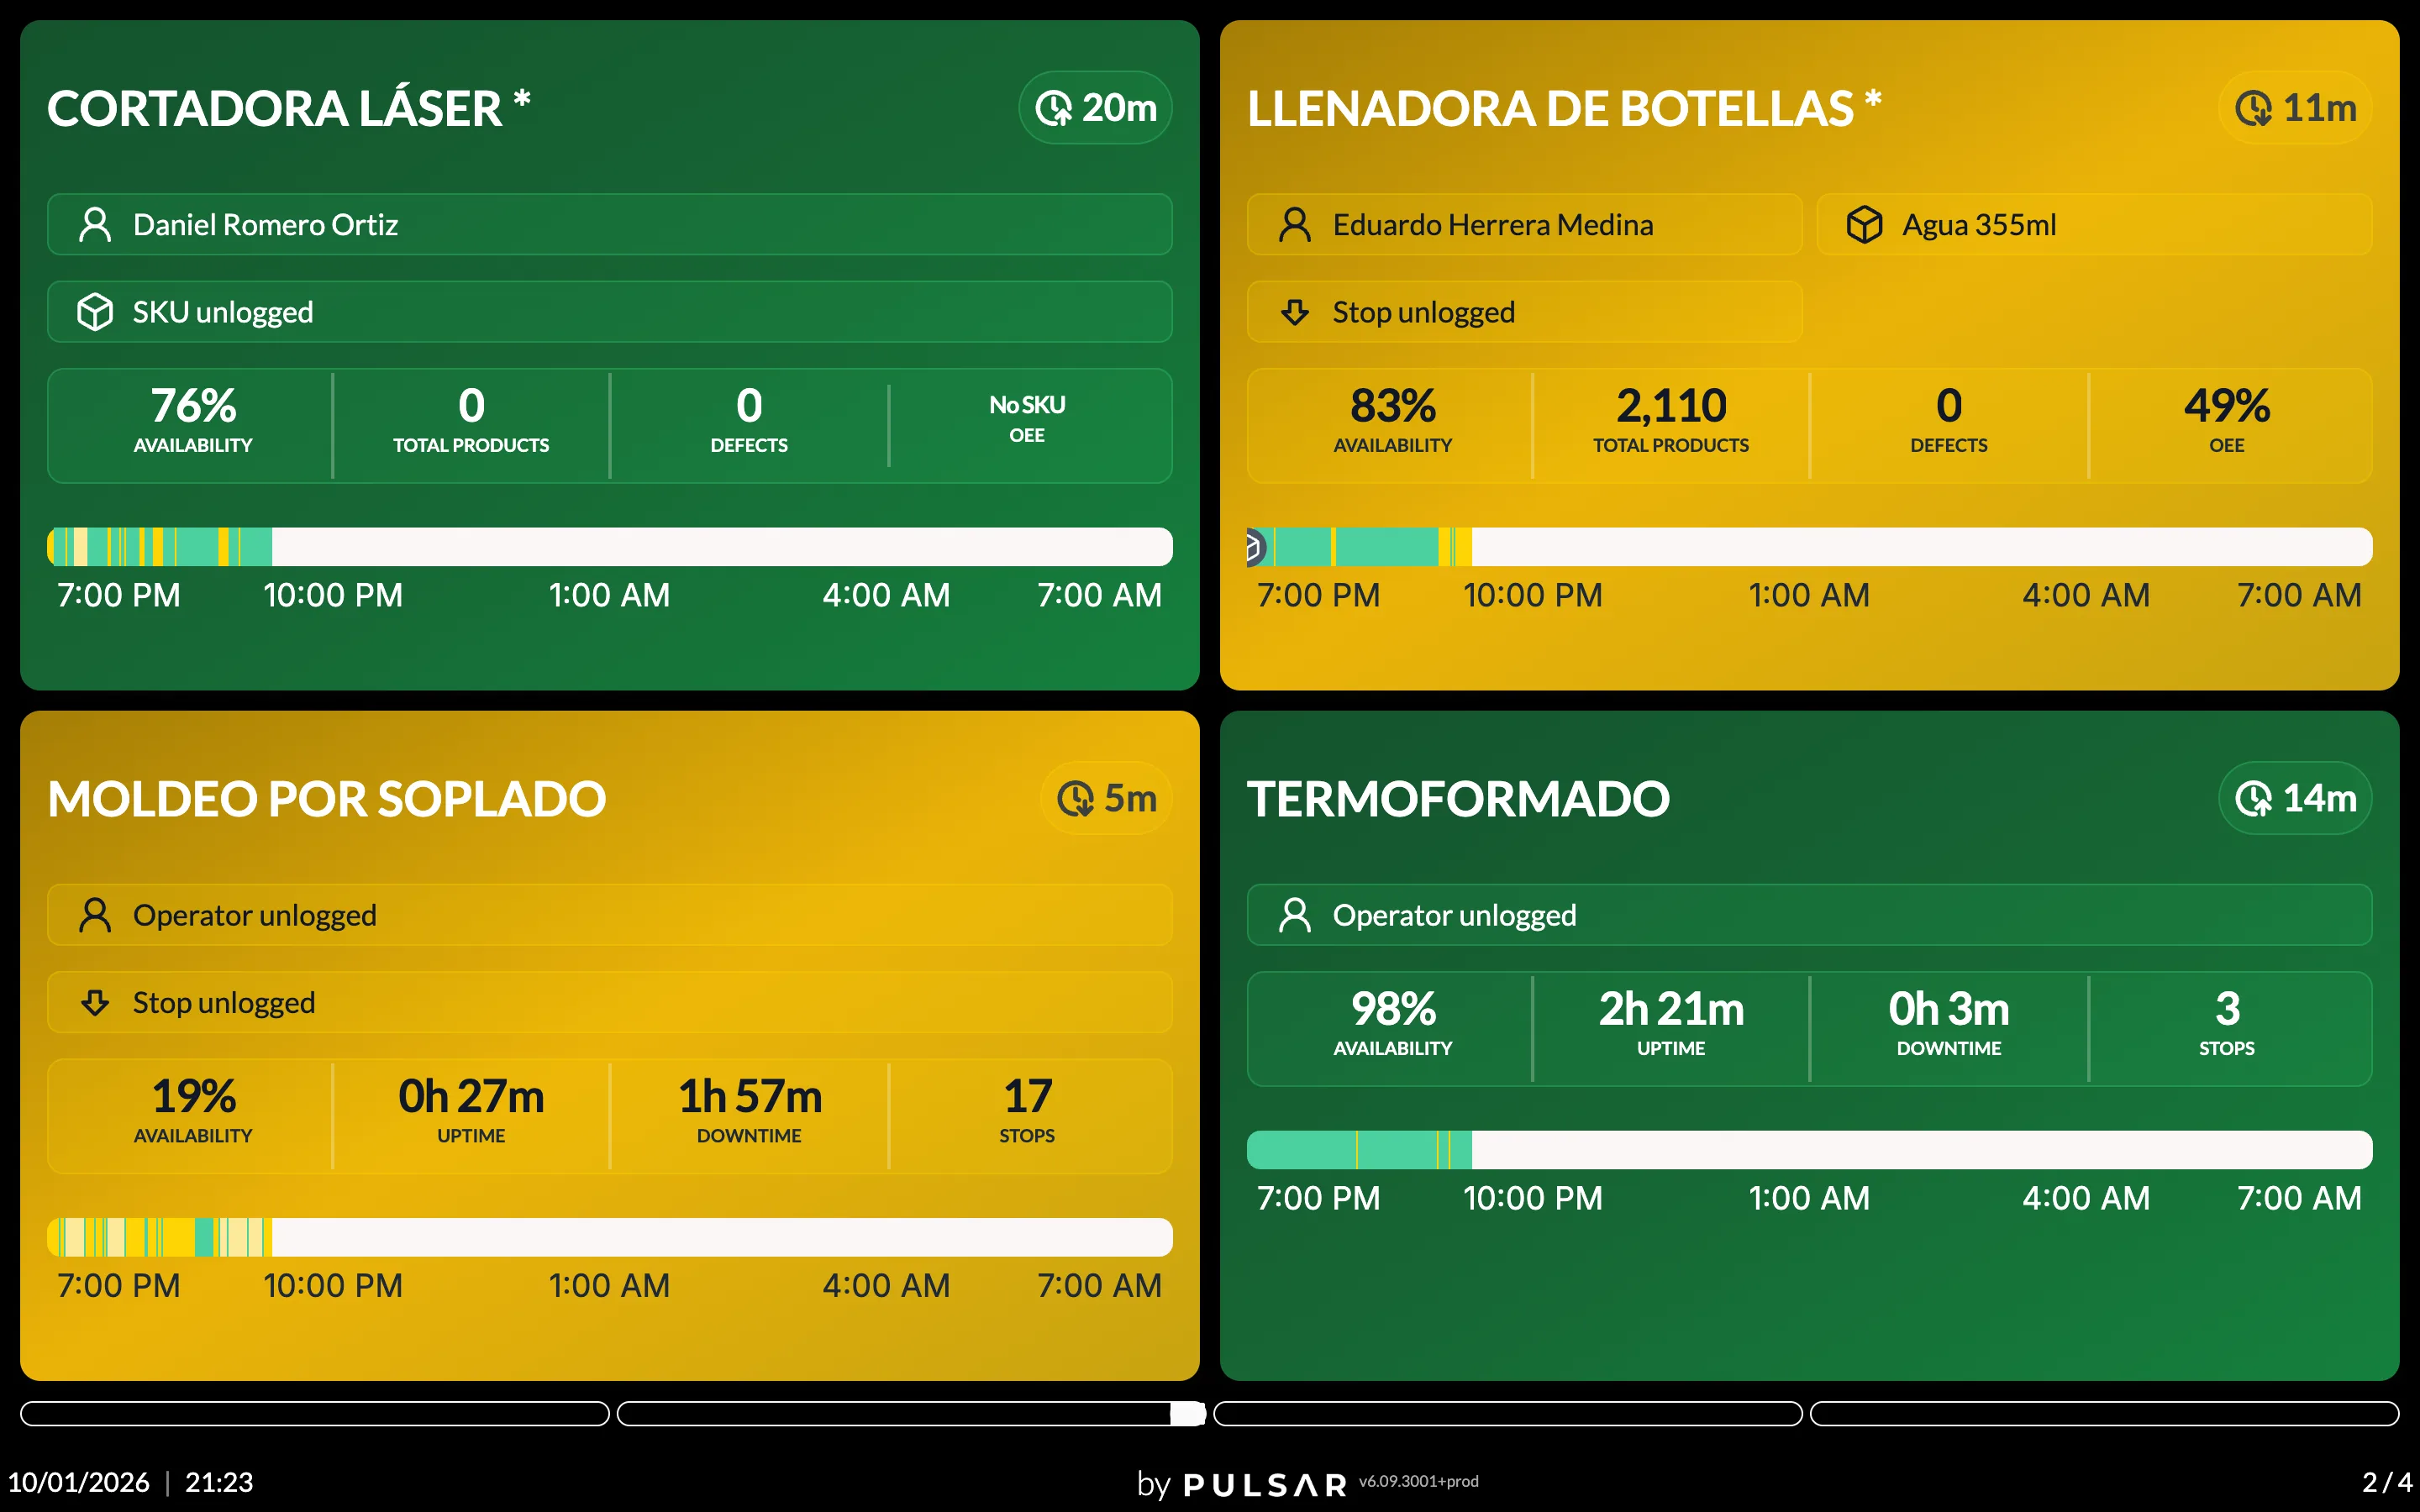
To set it up:
- In Real Time Settings, open TV Mode.
- Choose the view:
- Single machine view: each machine in detail, full screen.
- Tower Control Machine View: several machines on one screen. In Choose layout configuration, pick 2x2, 3x3, 6x2 (6 rows by 2 columns) or 8x4 (8 rows by 4 columns). Layouts can't be customized.
- Tower Control Operator View: the operators' production performance in a table.
- Choose the Slide transition time: 15 seconds, 30 seconds or 60 seconds.
- Optionally turn on Hide machines without an active shift, under Hide out-of-shift machines.
- For the machine views, choose the Status time shown on the cards (Elapsed time, Time of the change or Both) and, under Card information, whether to Show operator, Show SKU and Show SKU description, and how much of the Stop cause to show: Hidden, General, General + specific or Specific. These card options are for Single machine view and the 2x2 layout; the 3x3, 6x2 and 8x4 layouts show less, as TV mode explains.
- Select the machines and choose the metrics for each one: up to 4 per machine, 2 in the 3x3 layout, and none in 6x2 and 8x4.
- Click Save.
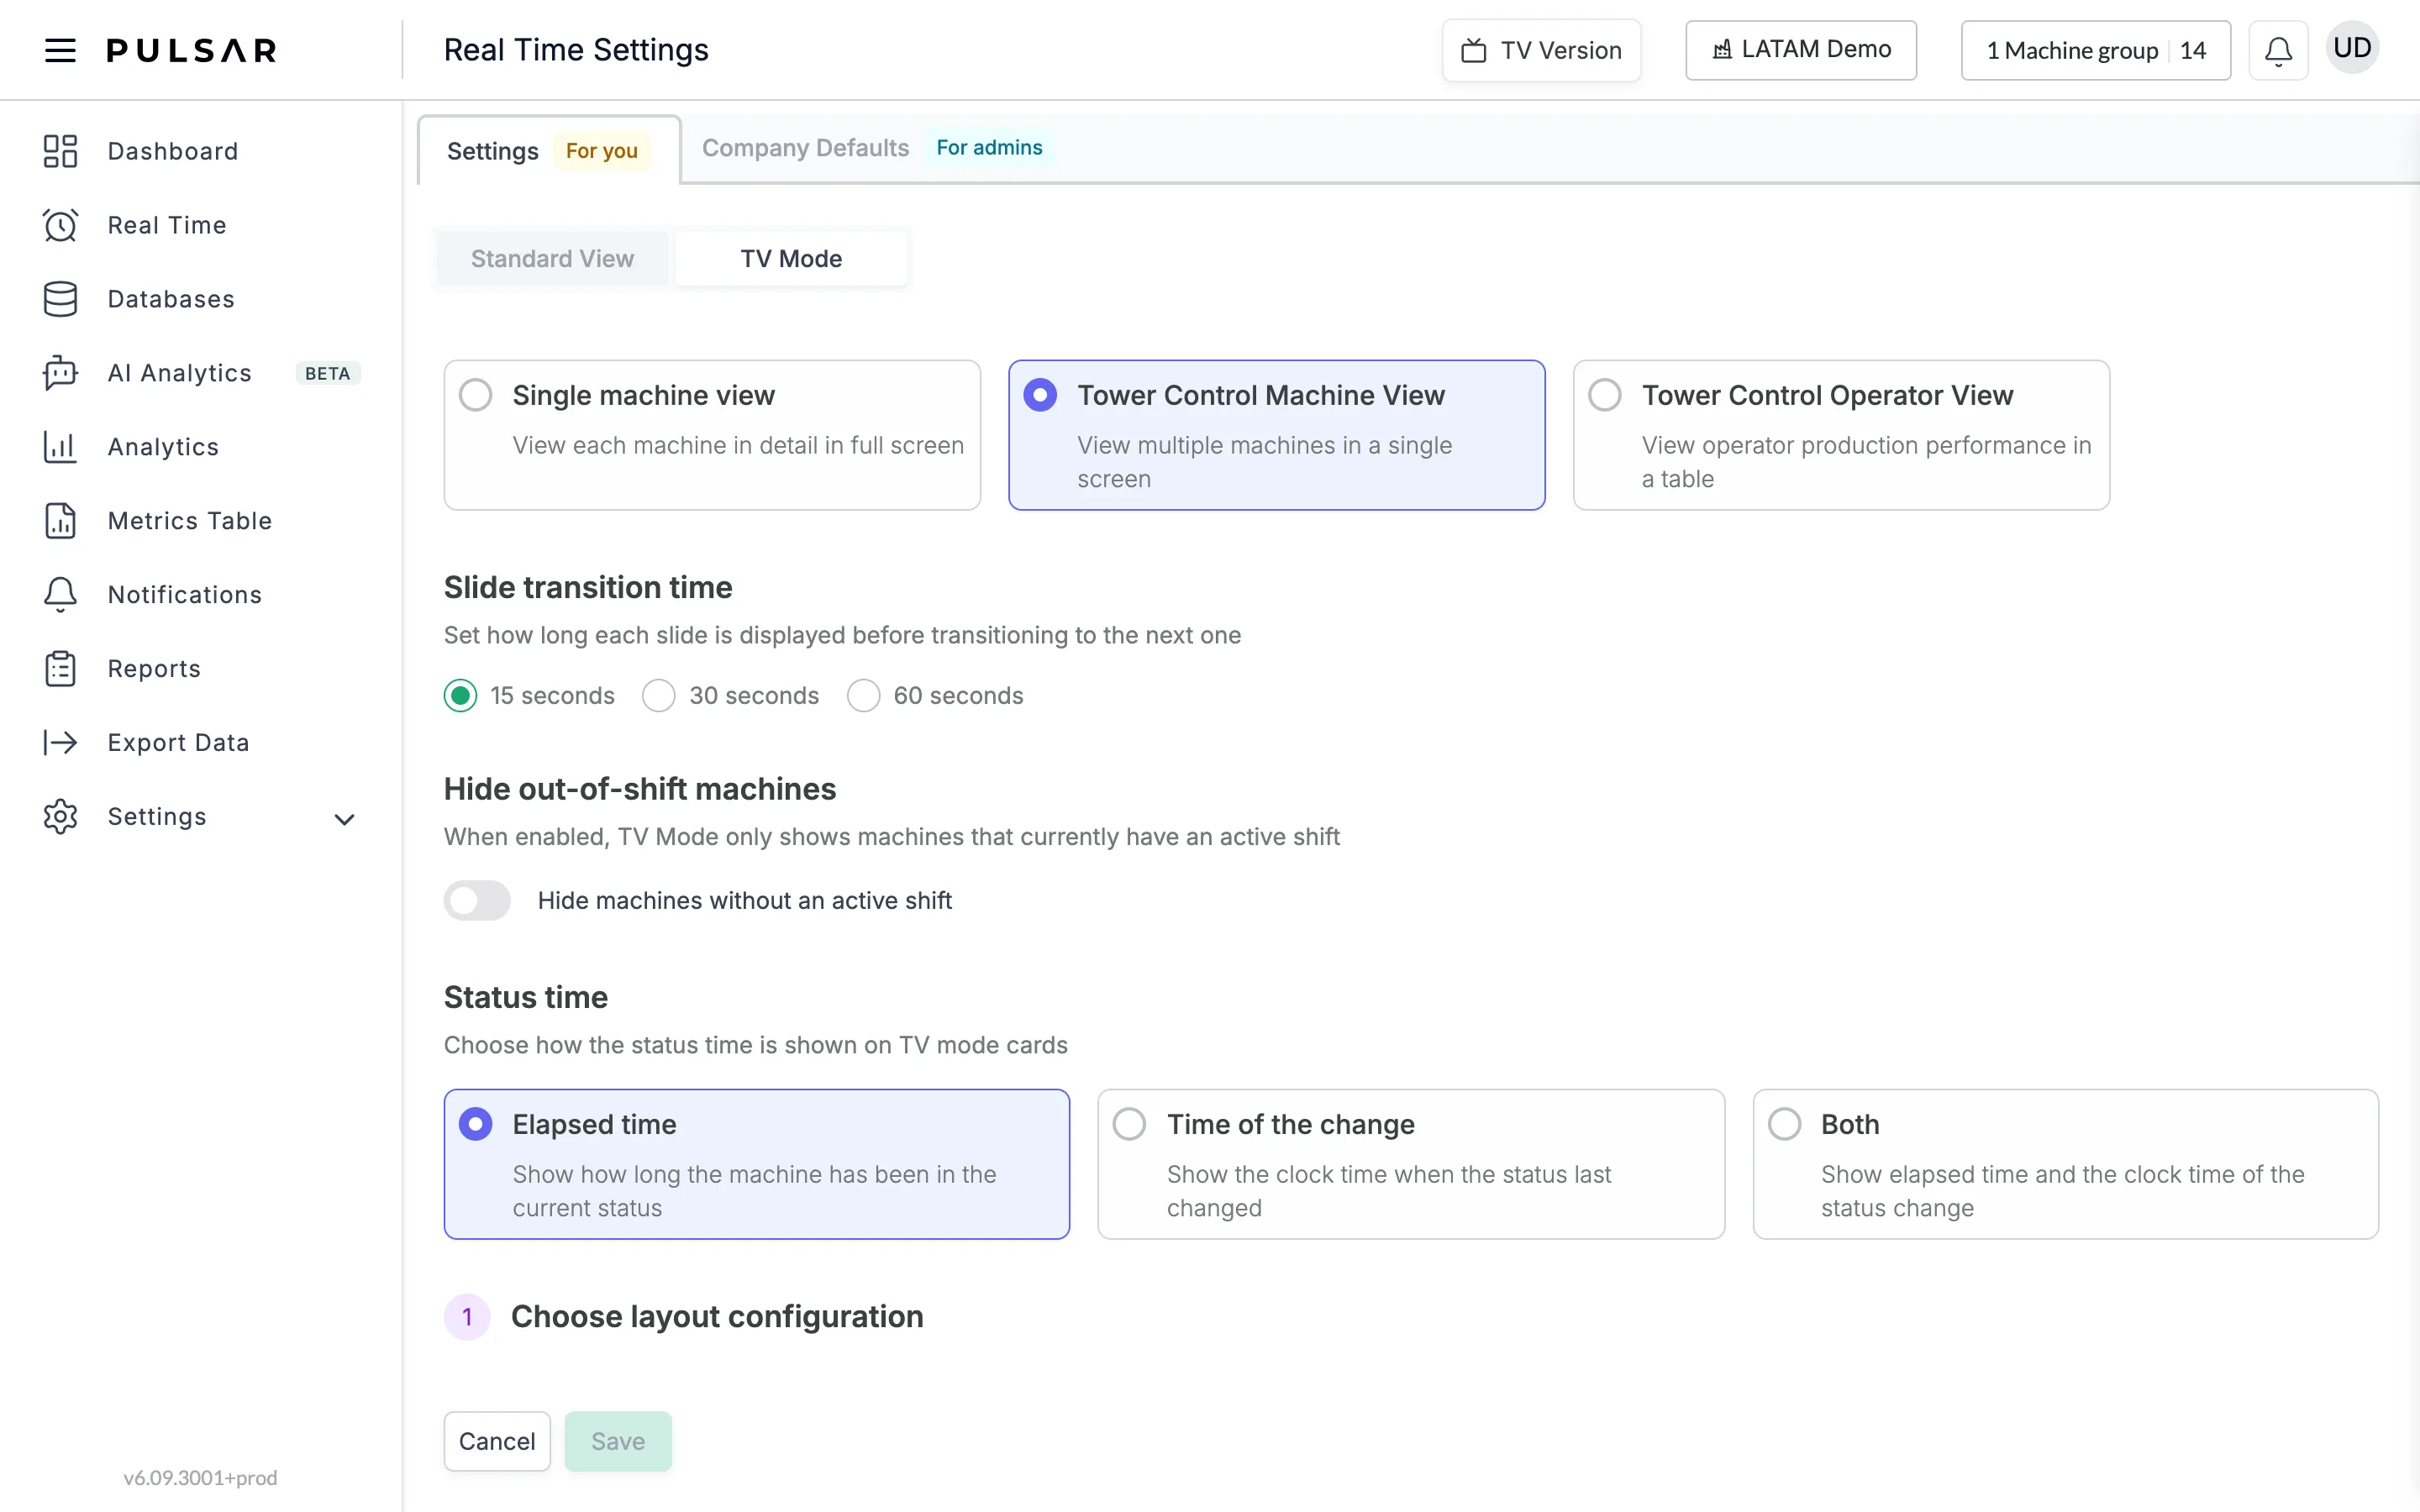
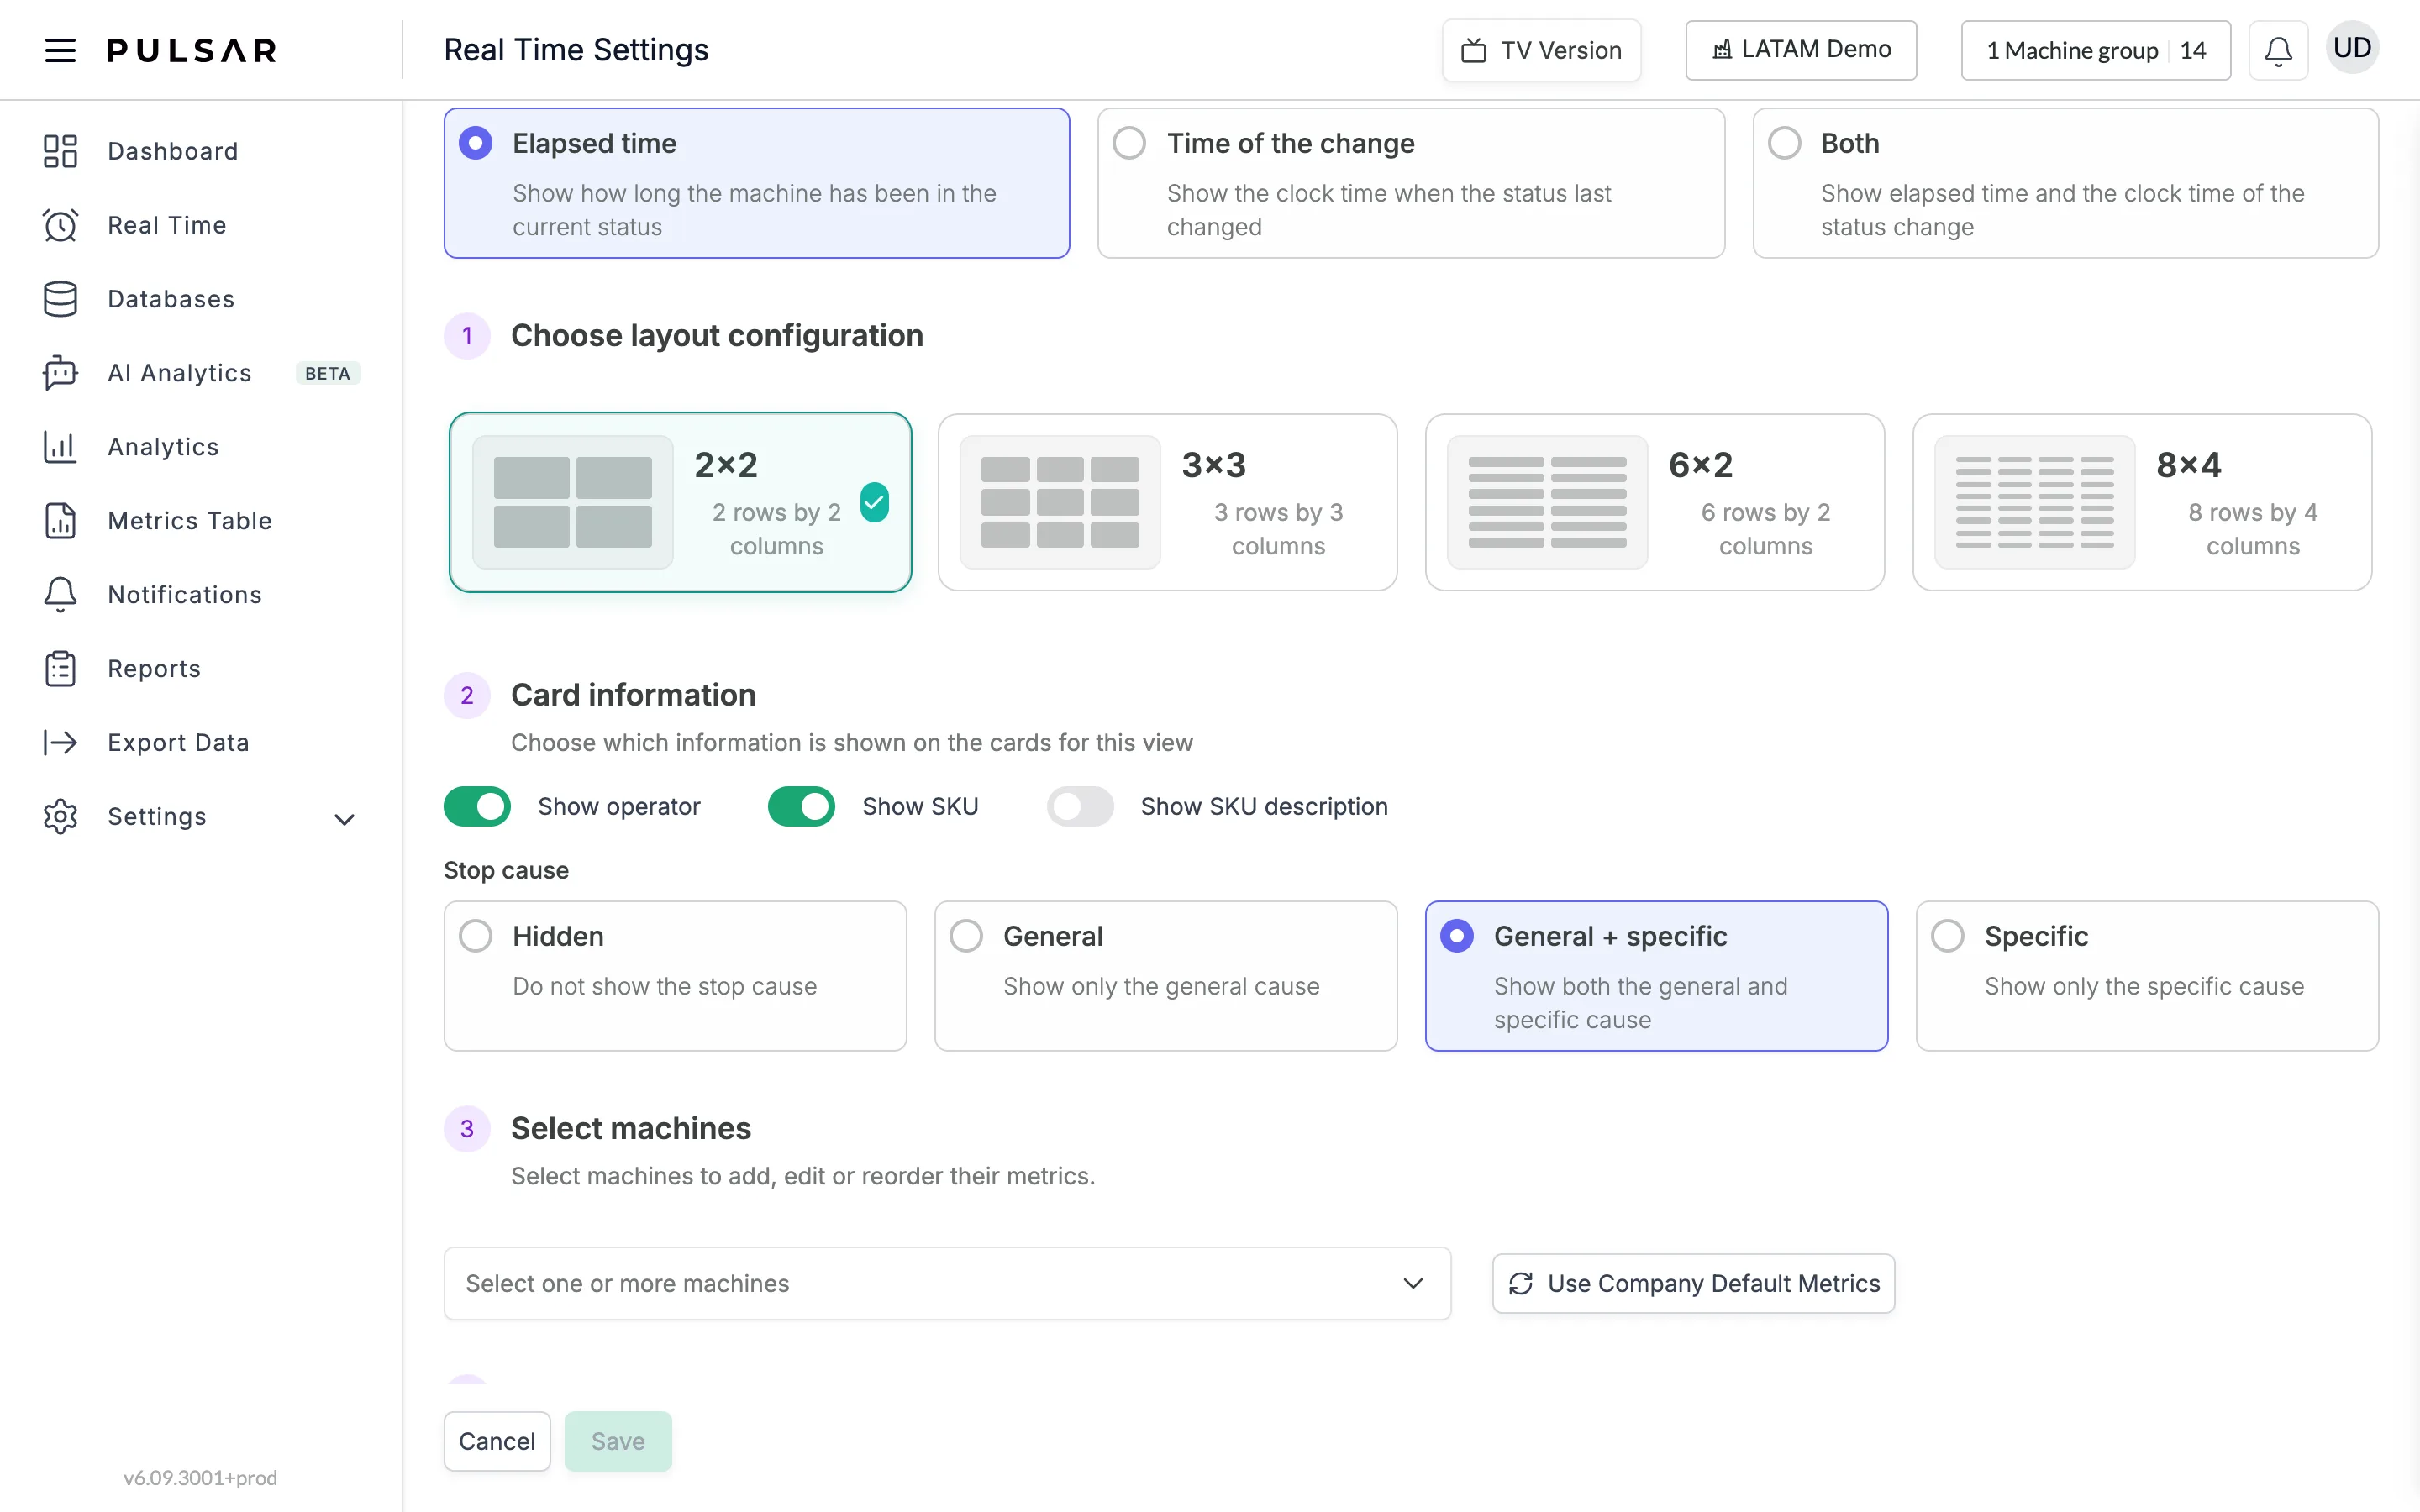
On the Company Defaults tab, administrators find the same TV Mode options. There, Save and Apply for All Users with no machines selected applies only the TV layout.
Historical shifts
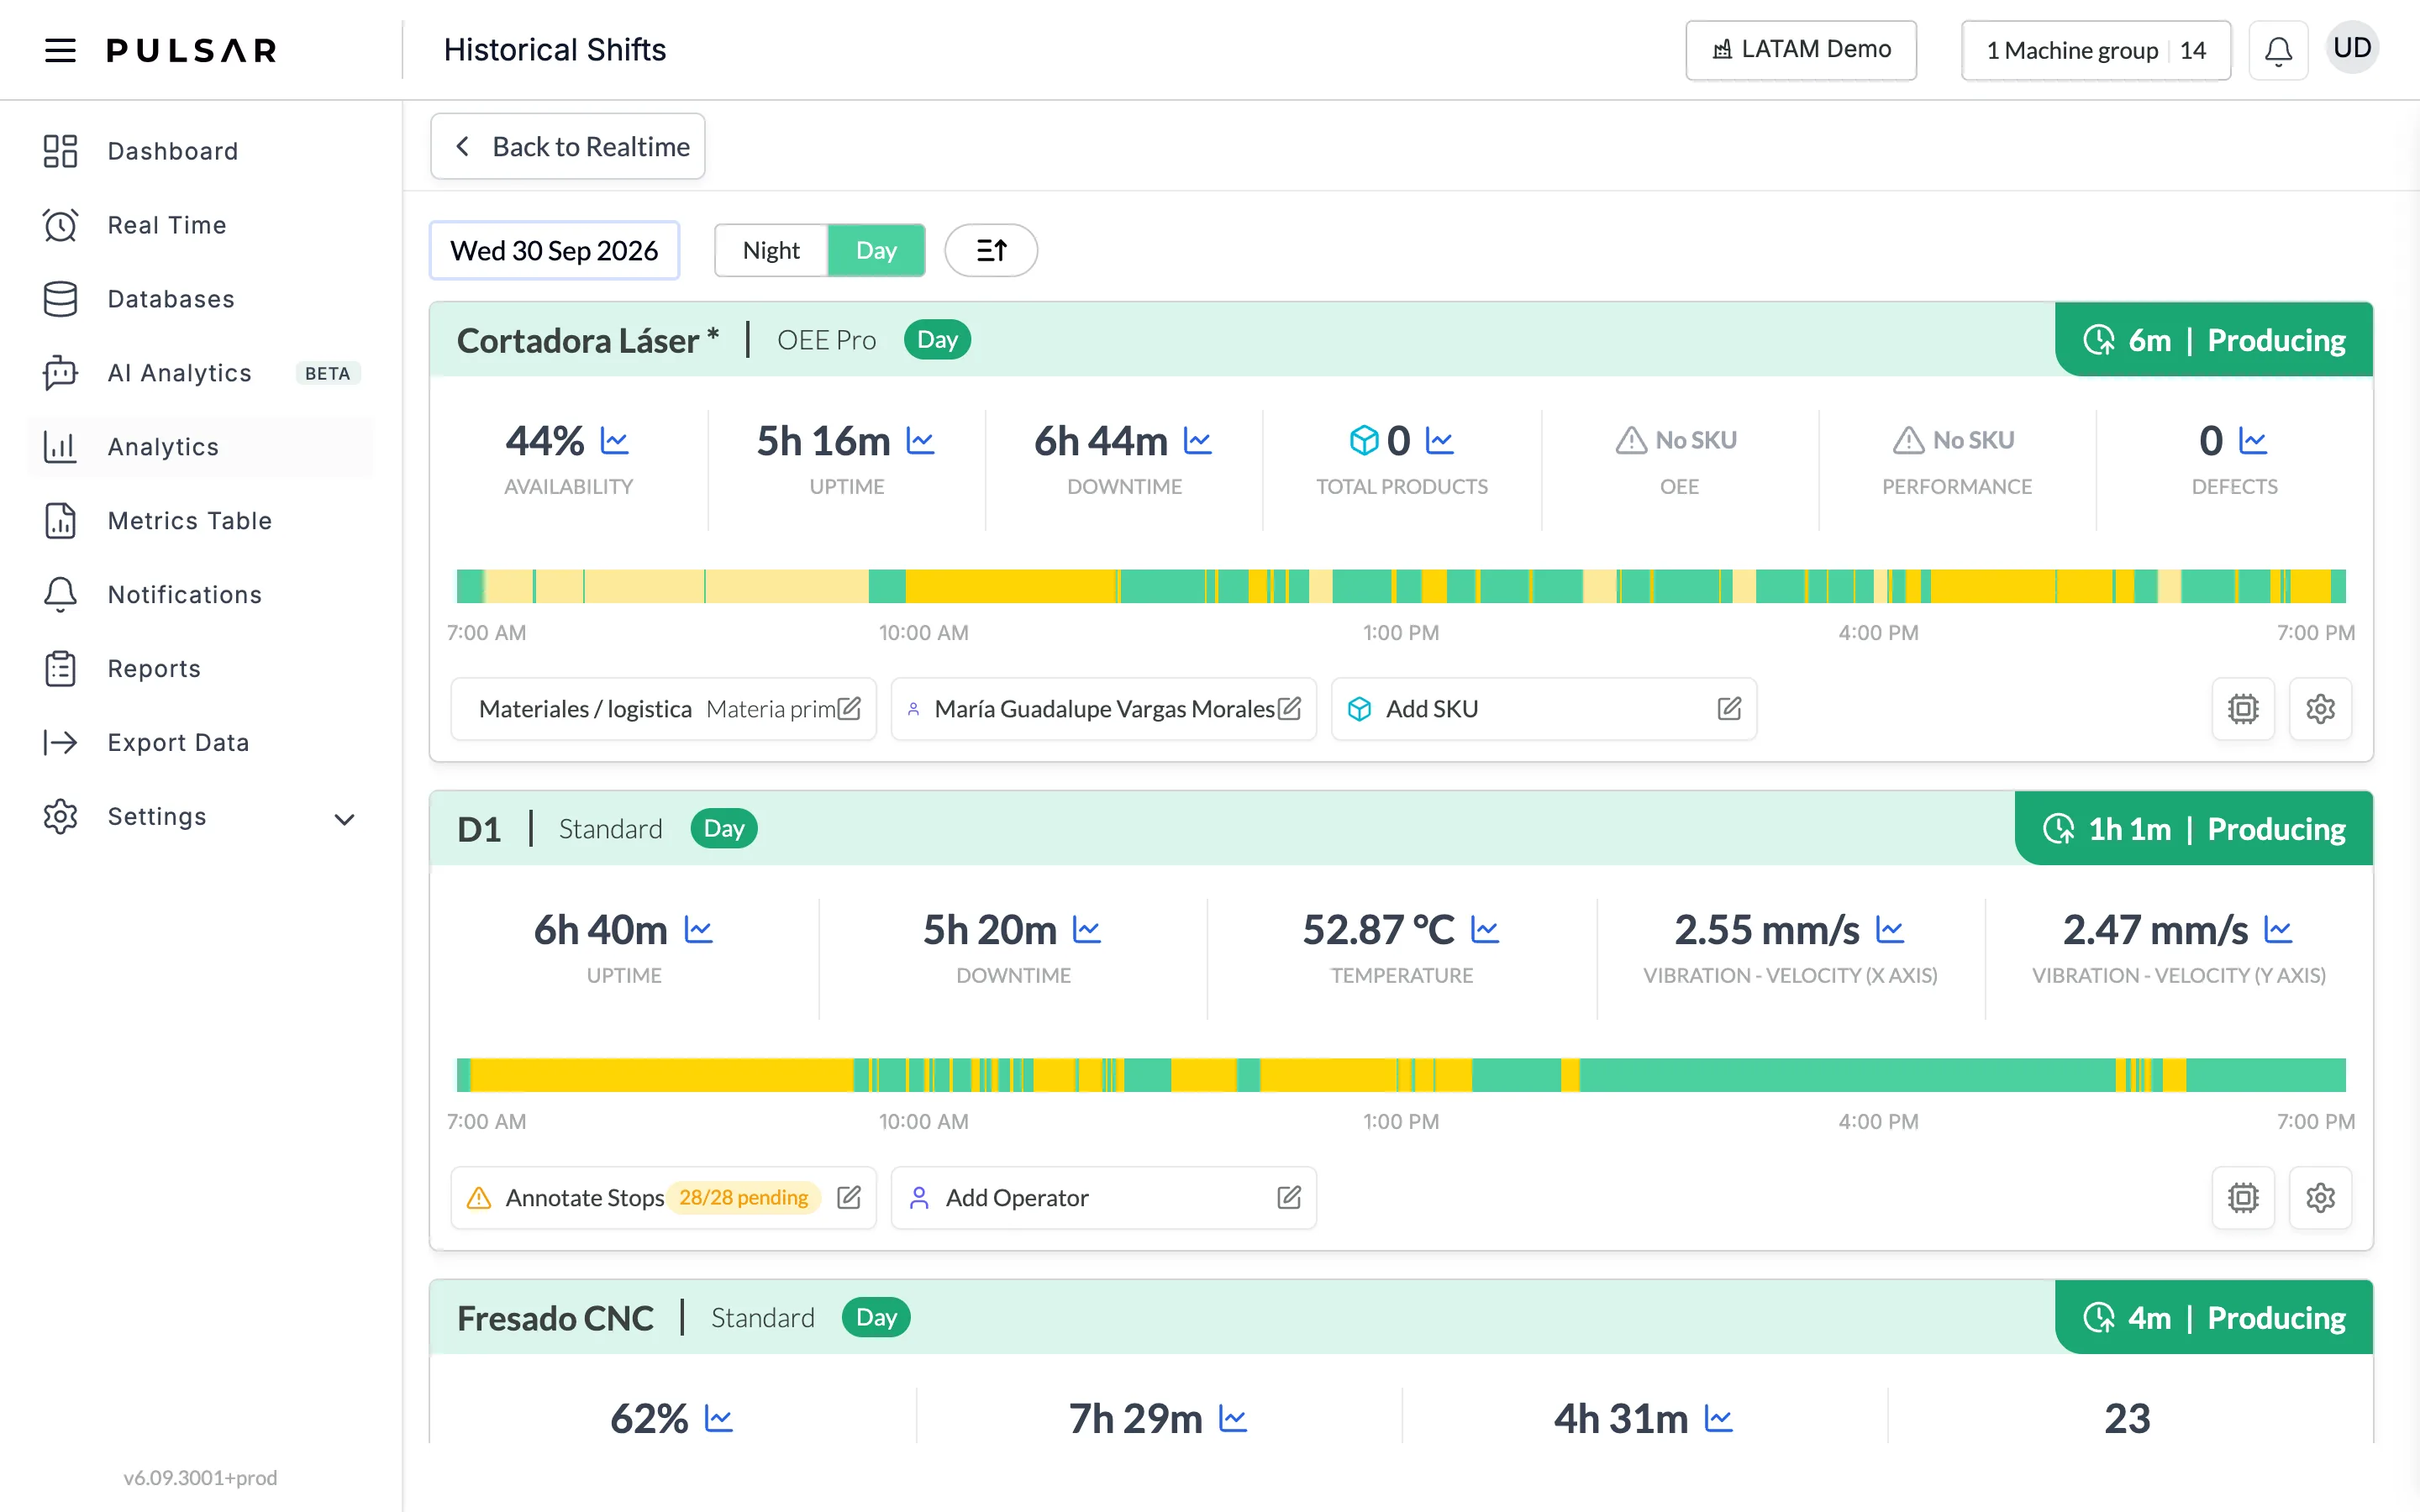
You can review past shifts directly from the Real Time page, and add information that was missing from them with the same card buttons.
- Click Historical Shifts.
- Choose the date and the shift to review, such as Night or Day. The button next to the shifts sorts the cards by machine name or in the order defined by your admin, ascending or descending.
To go back, click Back to Realtime.

For TV layout and card display options, see TV mode.
If you have trouble with the Real Time page or need help, contact your Customer Success representative or raise a support ticket from the app.
Raise a support ticket
Ask Pulsar's support team for help from the desktop app or the mobile app, with the details that get your ticket solved faster.
Dashboard
See how many machines are stopped or working right now, and your plant's availability, stop classification and main stop causes for today, yesterday or the week.