Reports
Set up reports that Pulsar emails automatically, daily, weekly or monthly, with the charts you choose, and review what was sent.
Get the key information about your operation delivered to your email, 100% automatically and whenever you want. Stay up to date with daily, weekly or monthly reports to make informed decisions and optimize your operation.
Create a report
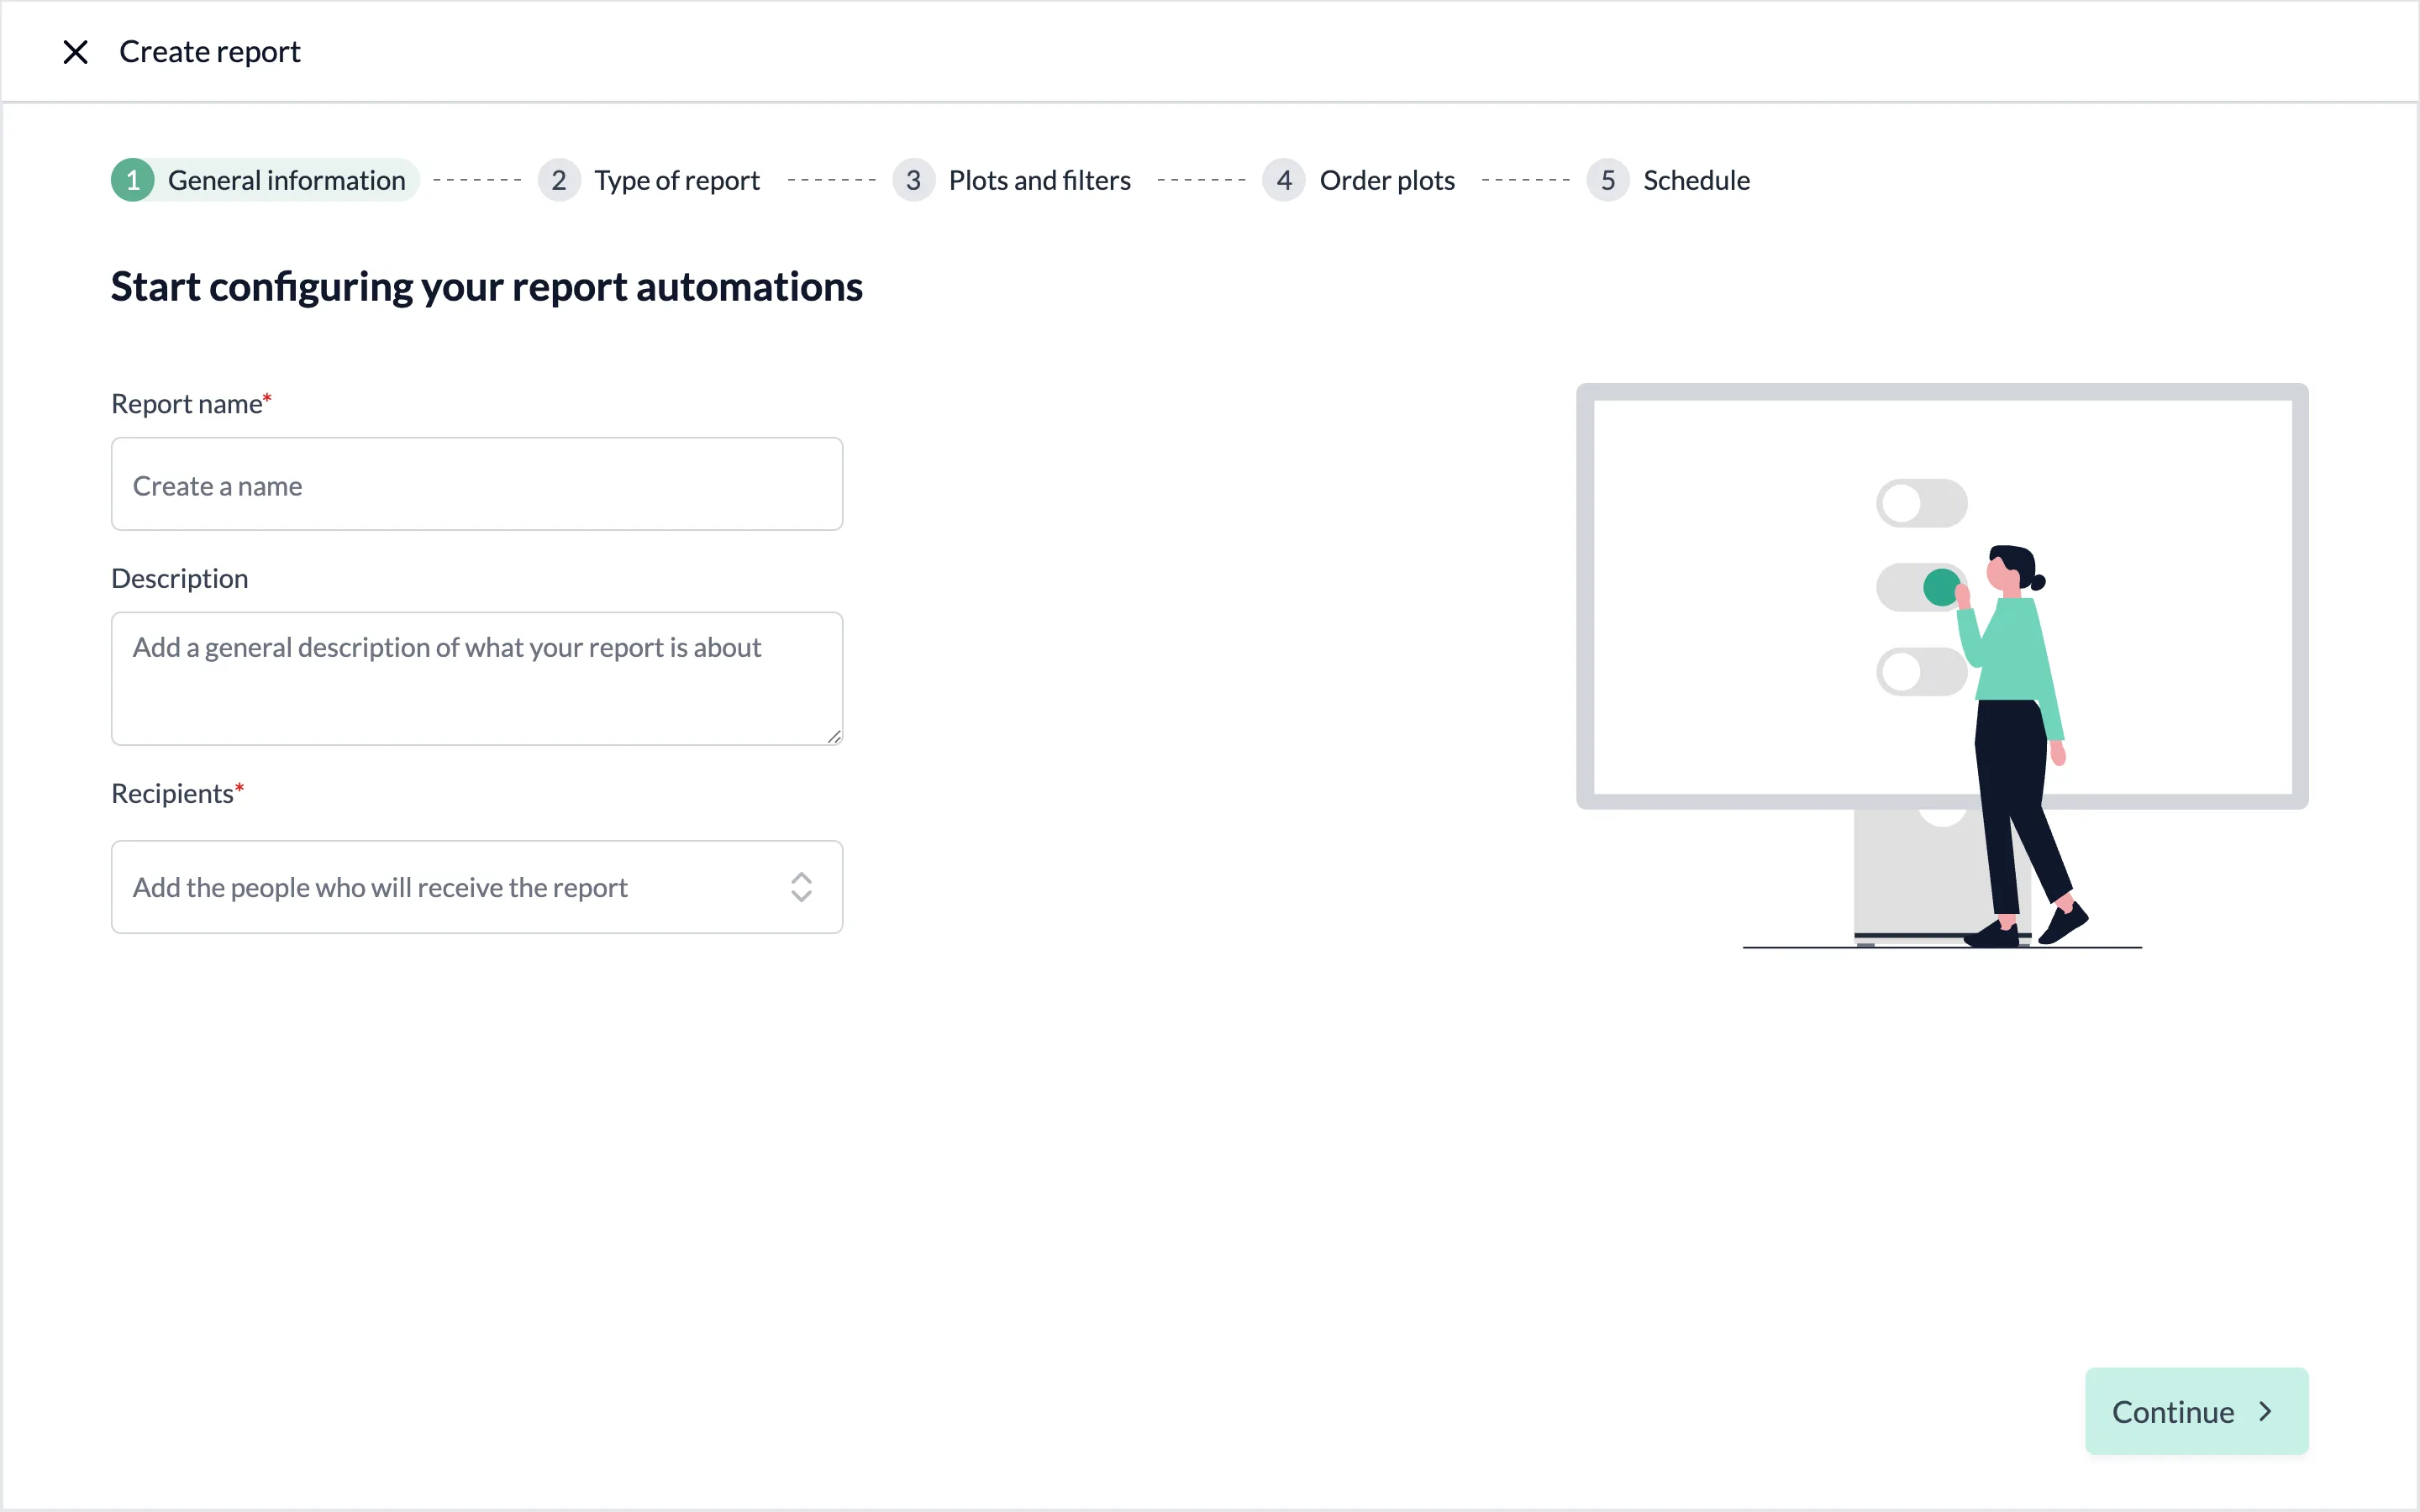
Click Reports in the left-hand menu, then Create report at the top right. The setup has five steps, shown at the top of the screen. Use Continue to move forward and Go back to return to the previous step. The X at the top left closes the setup without saving.
General information
Add the Report name, an optional Description and the Recipients. Pick the recipients from your contacts list, or choose Select All Recipients.
Type of report
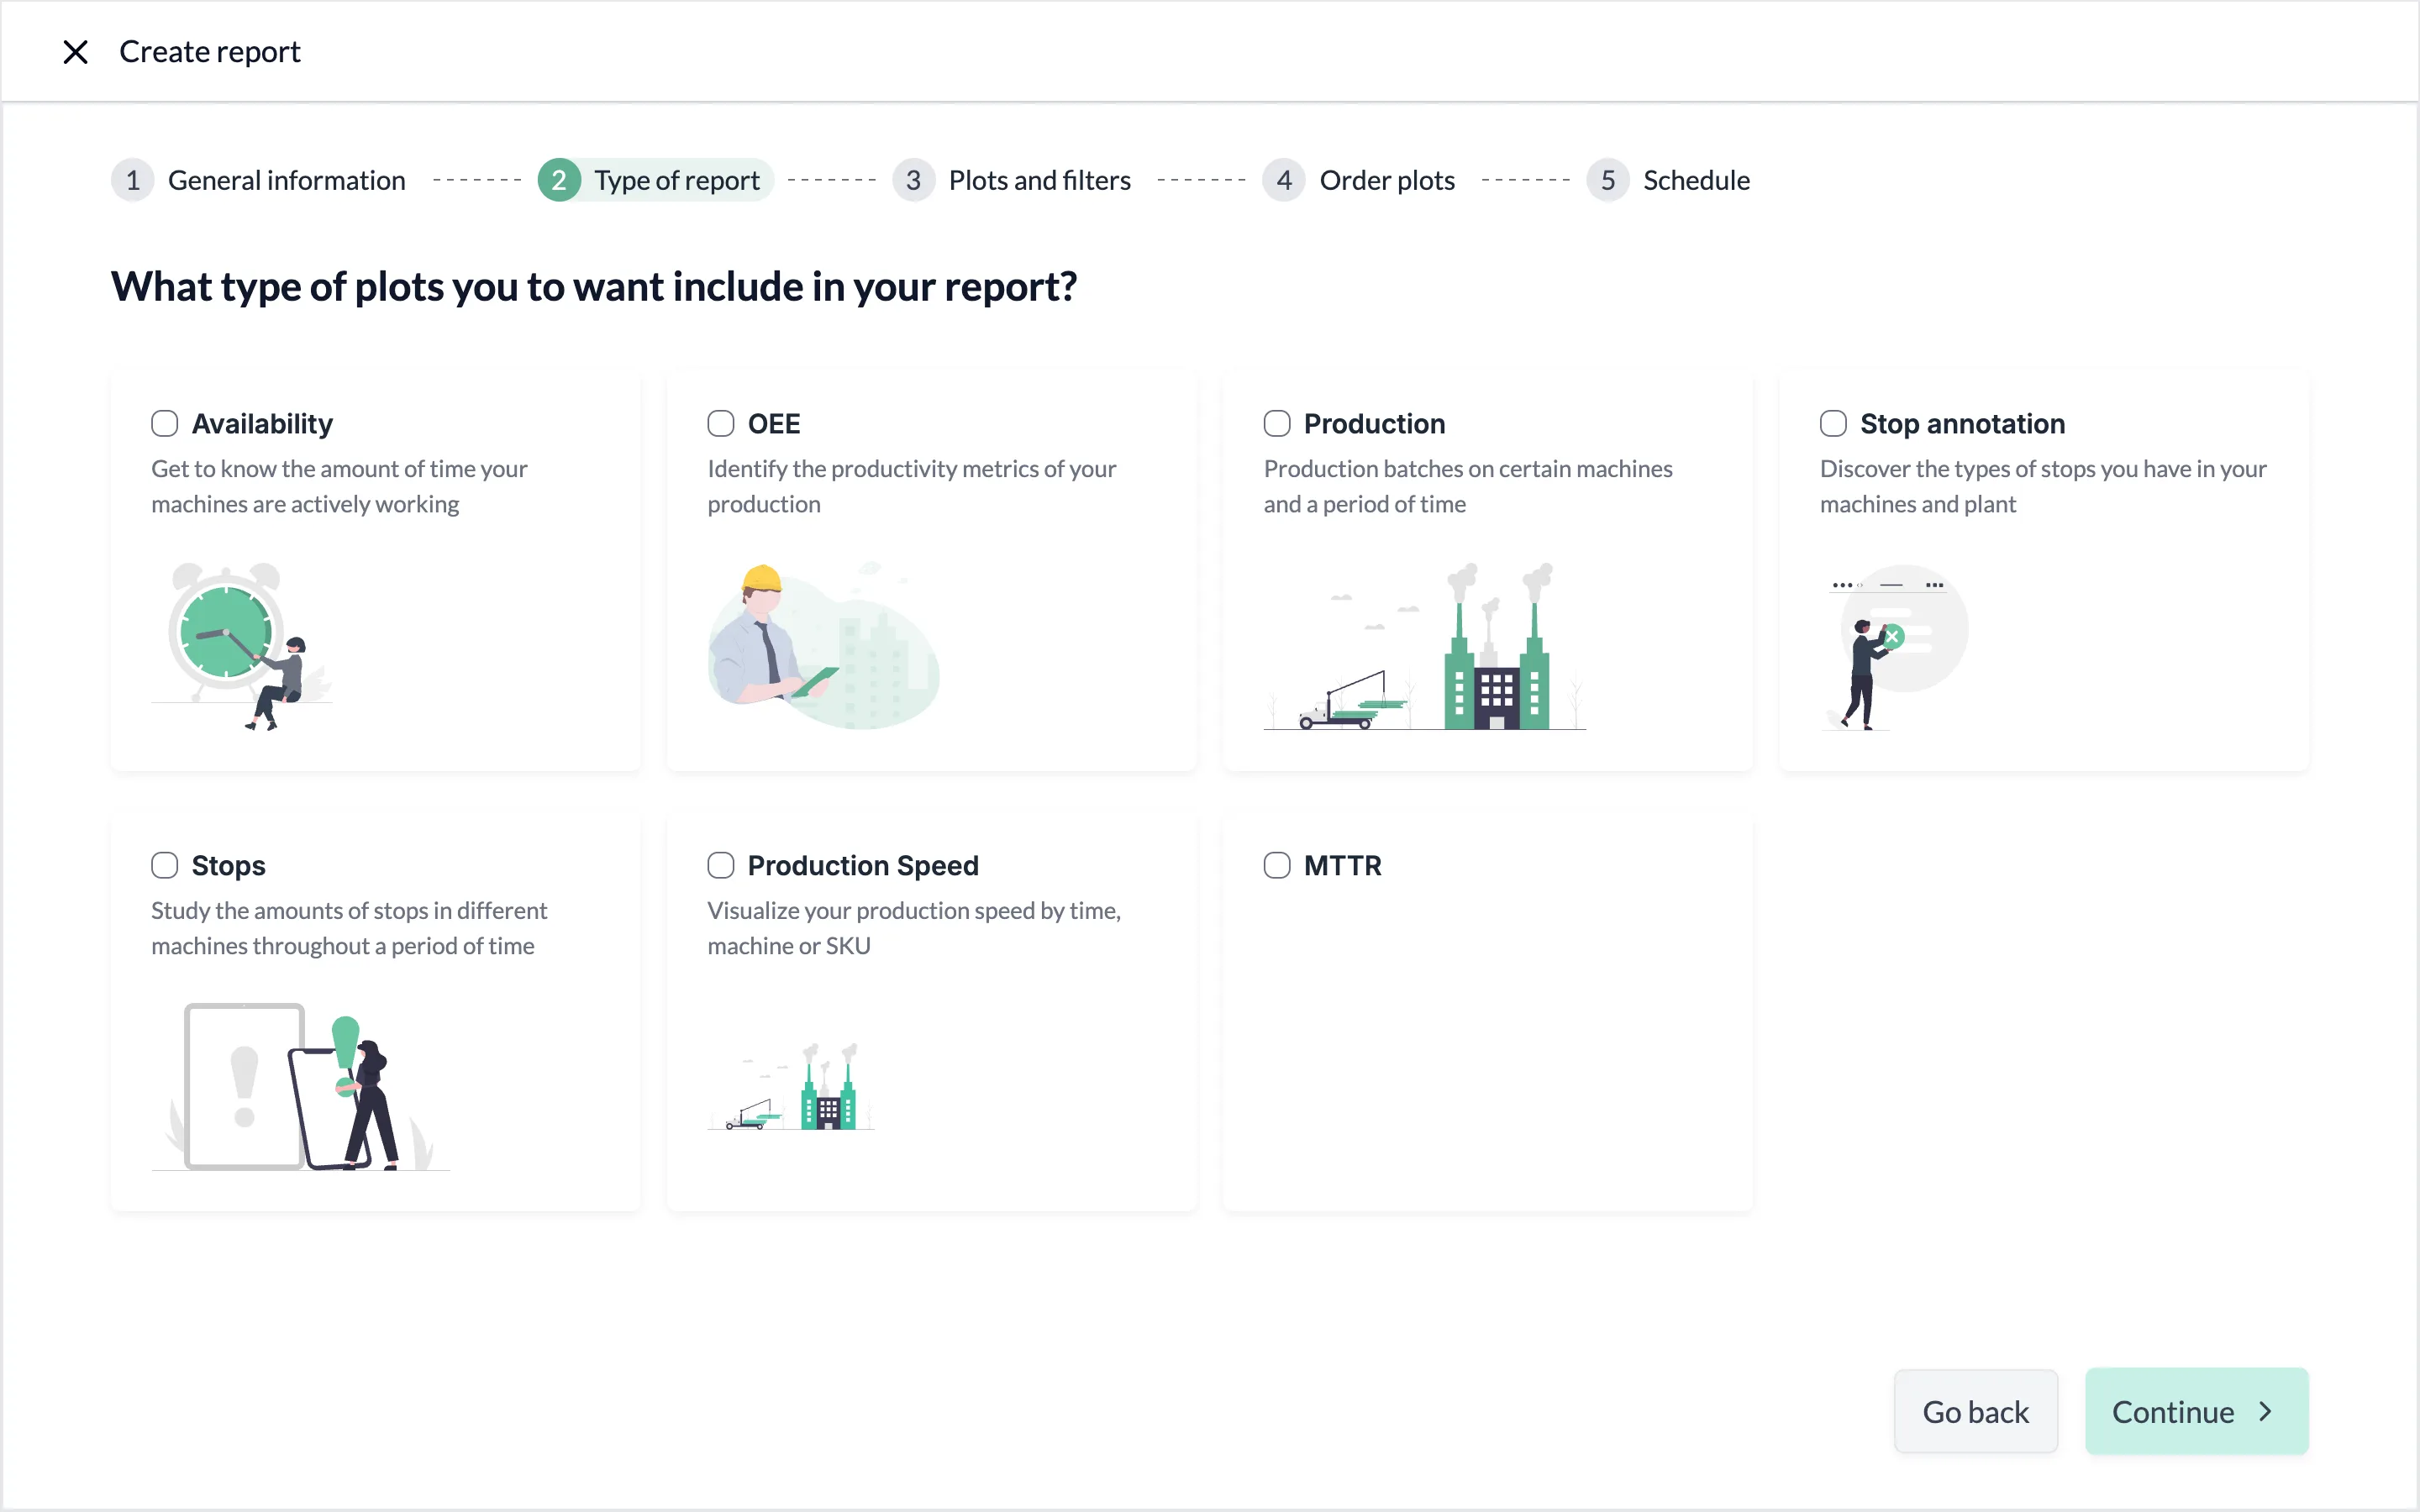
Select the topics you want to include in the report: Availability, OEE, Production, Stop annotation, Stops, Production Speed or MTTR.
Plots and filters
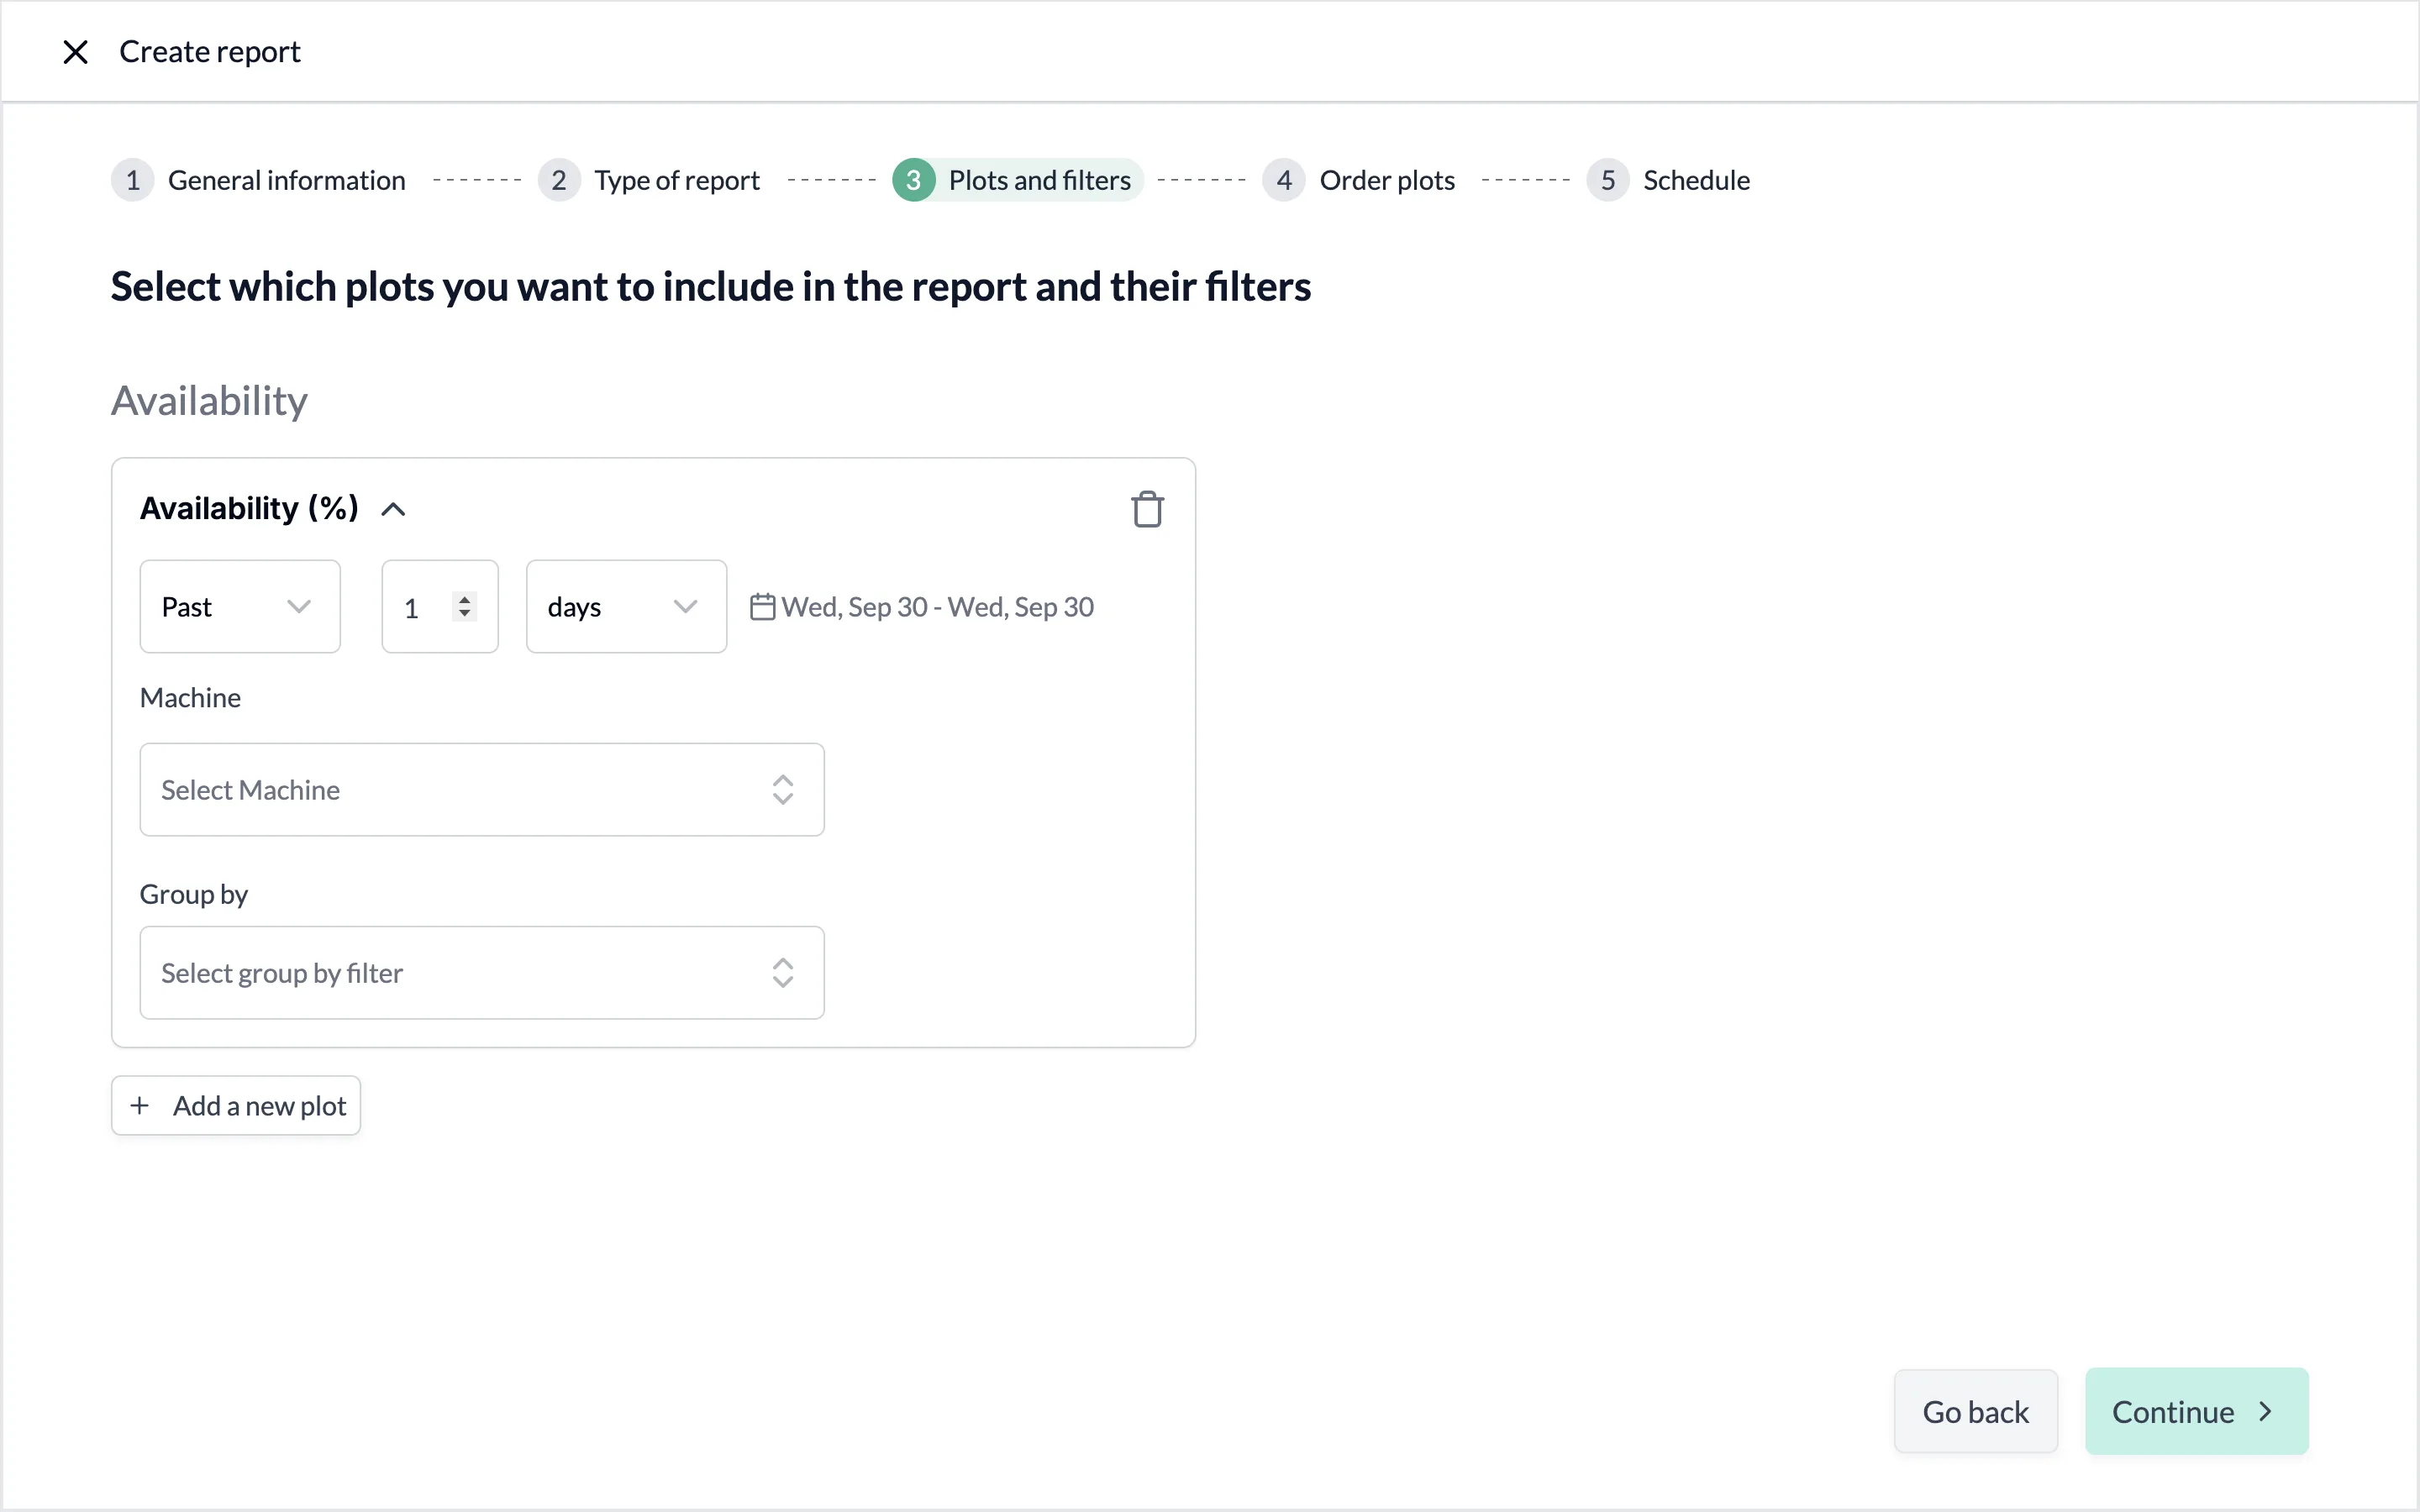
For each topic, click Add a new plot and choose a chart from the list. Then set up its filters:
- the time range: Past, Current or Last Shift, and a number of days, weeks or months. Pulsar shows the dates that range covers today.
- Machine: one or more machines, or all of them. It's required.
- the chart's own filters, such as Group by (Day, week, month or Shift) or Shift.
Click the trash icon on a chart to remove it.
Order plots
Drag each chart by the handle at the left of its row to set the order in which the charts appear in the report. The Filters column shows the filters set on each chart.
Schedule
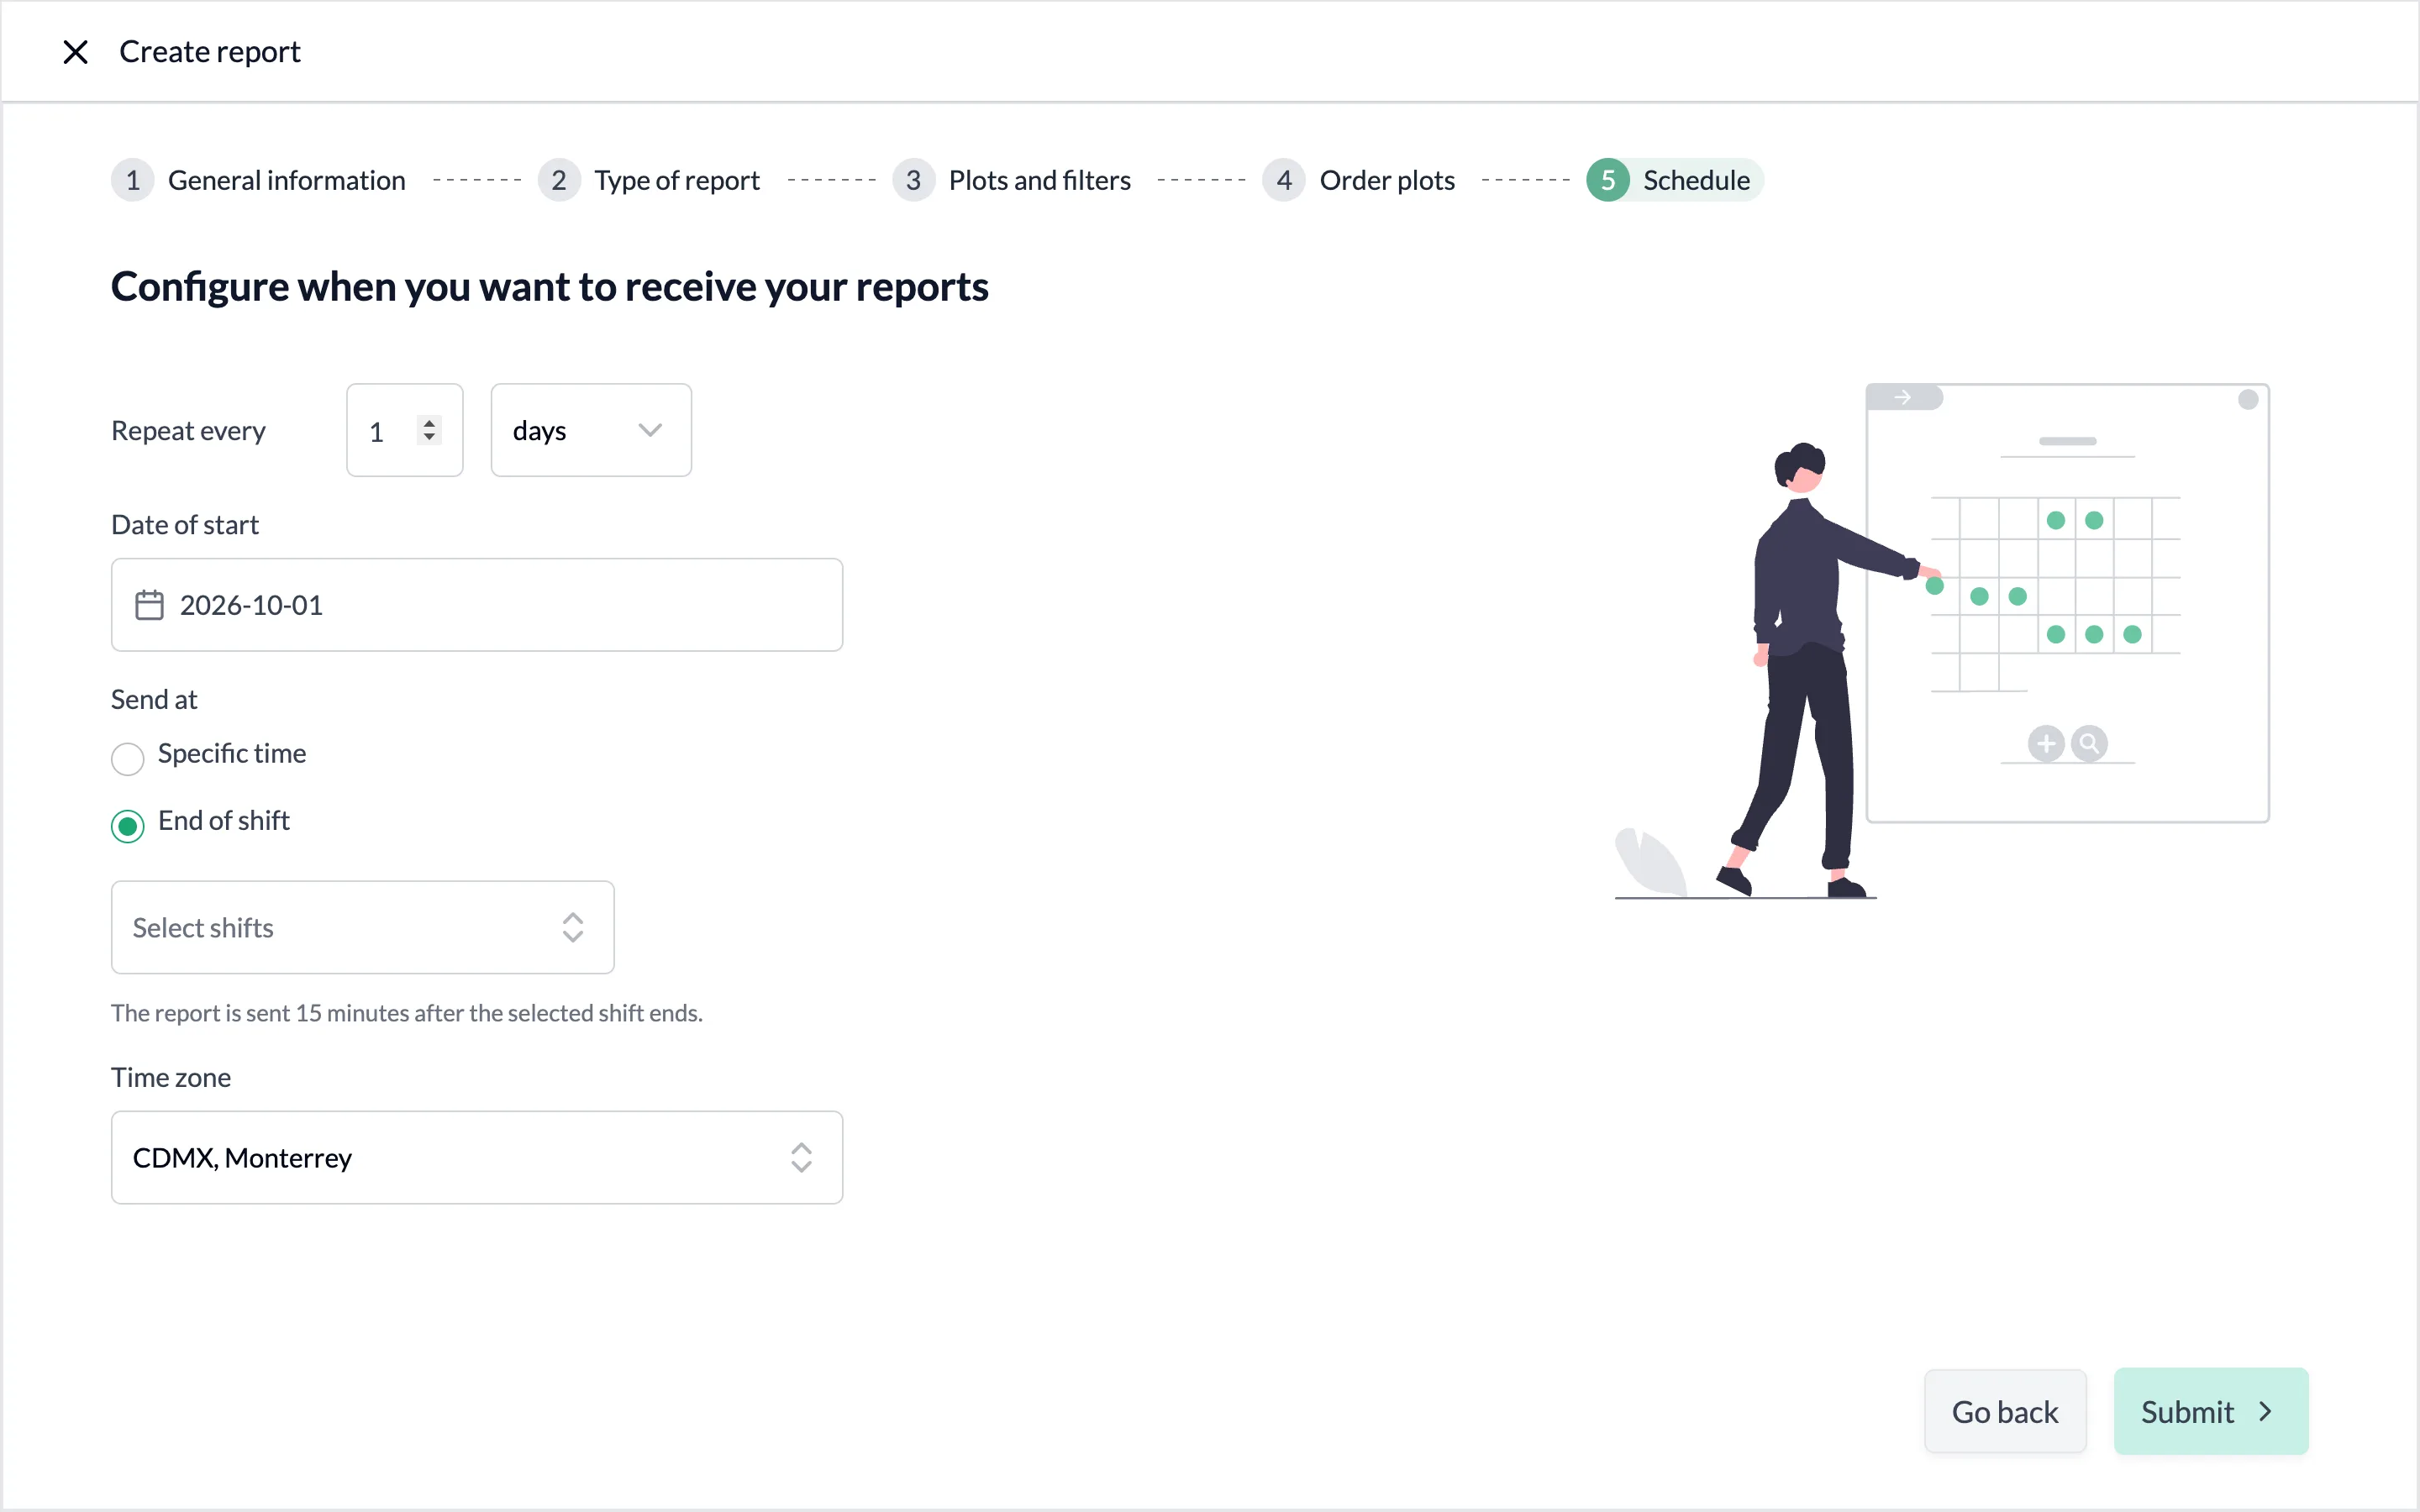
Set when the report is sent:
- Repeat every: a number of days, weeks or months. For weeks, pick the weekdays in Repeat on; for months, the days of the month.
- Date of start.
- Send at: a Specific time, or End of shift, where you pick the shifts and the report is sent 15 minutes after the selected shift ends.
- Time zone.
Click Submit to save the report.
Manage your reports
The Reports list shows each report's Name, Plots, Recipients, Created by and Last modified. Search for a report by name at the top left. Click the options button (⋯) on a report to View details, Duplicate, Edit or Delete it.
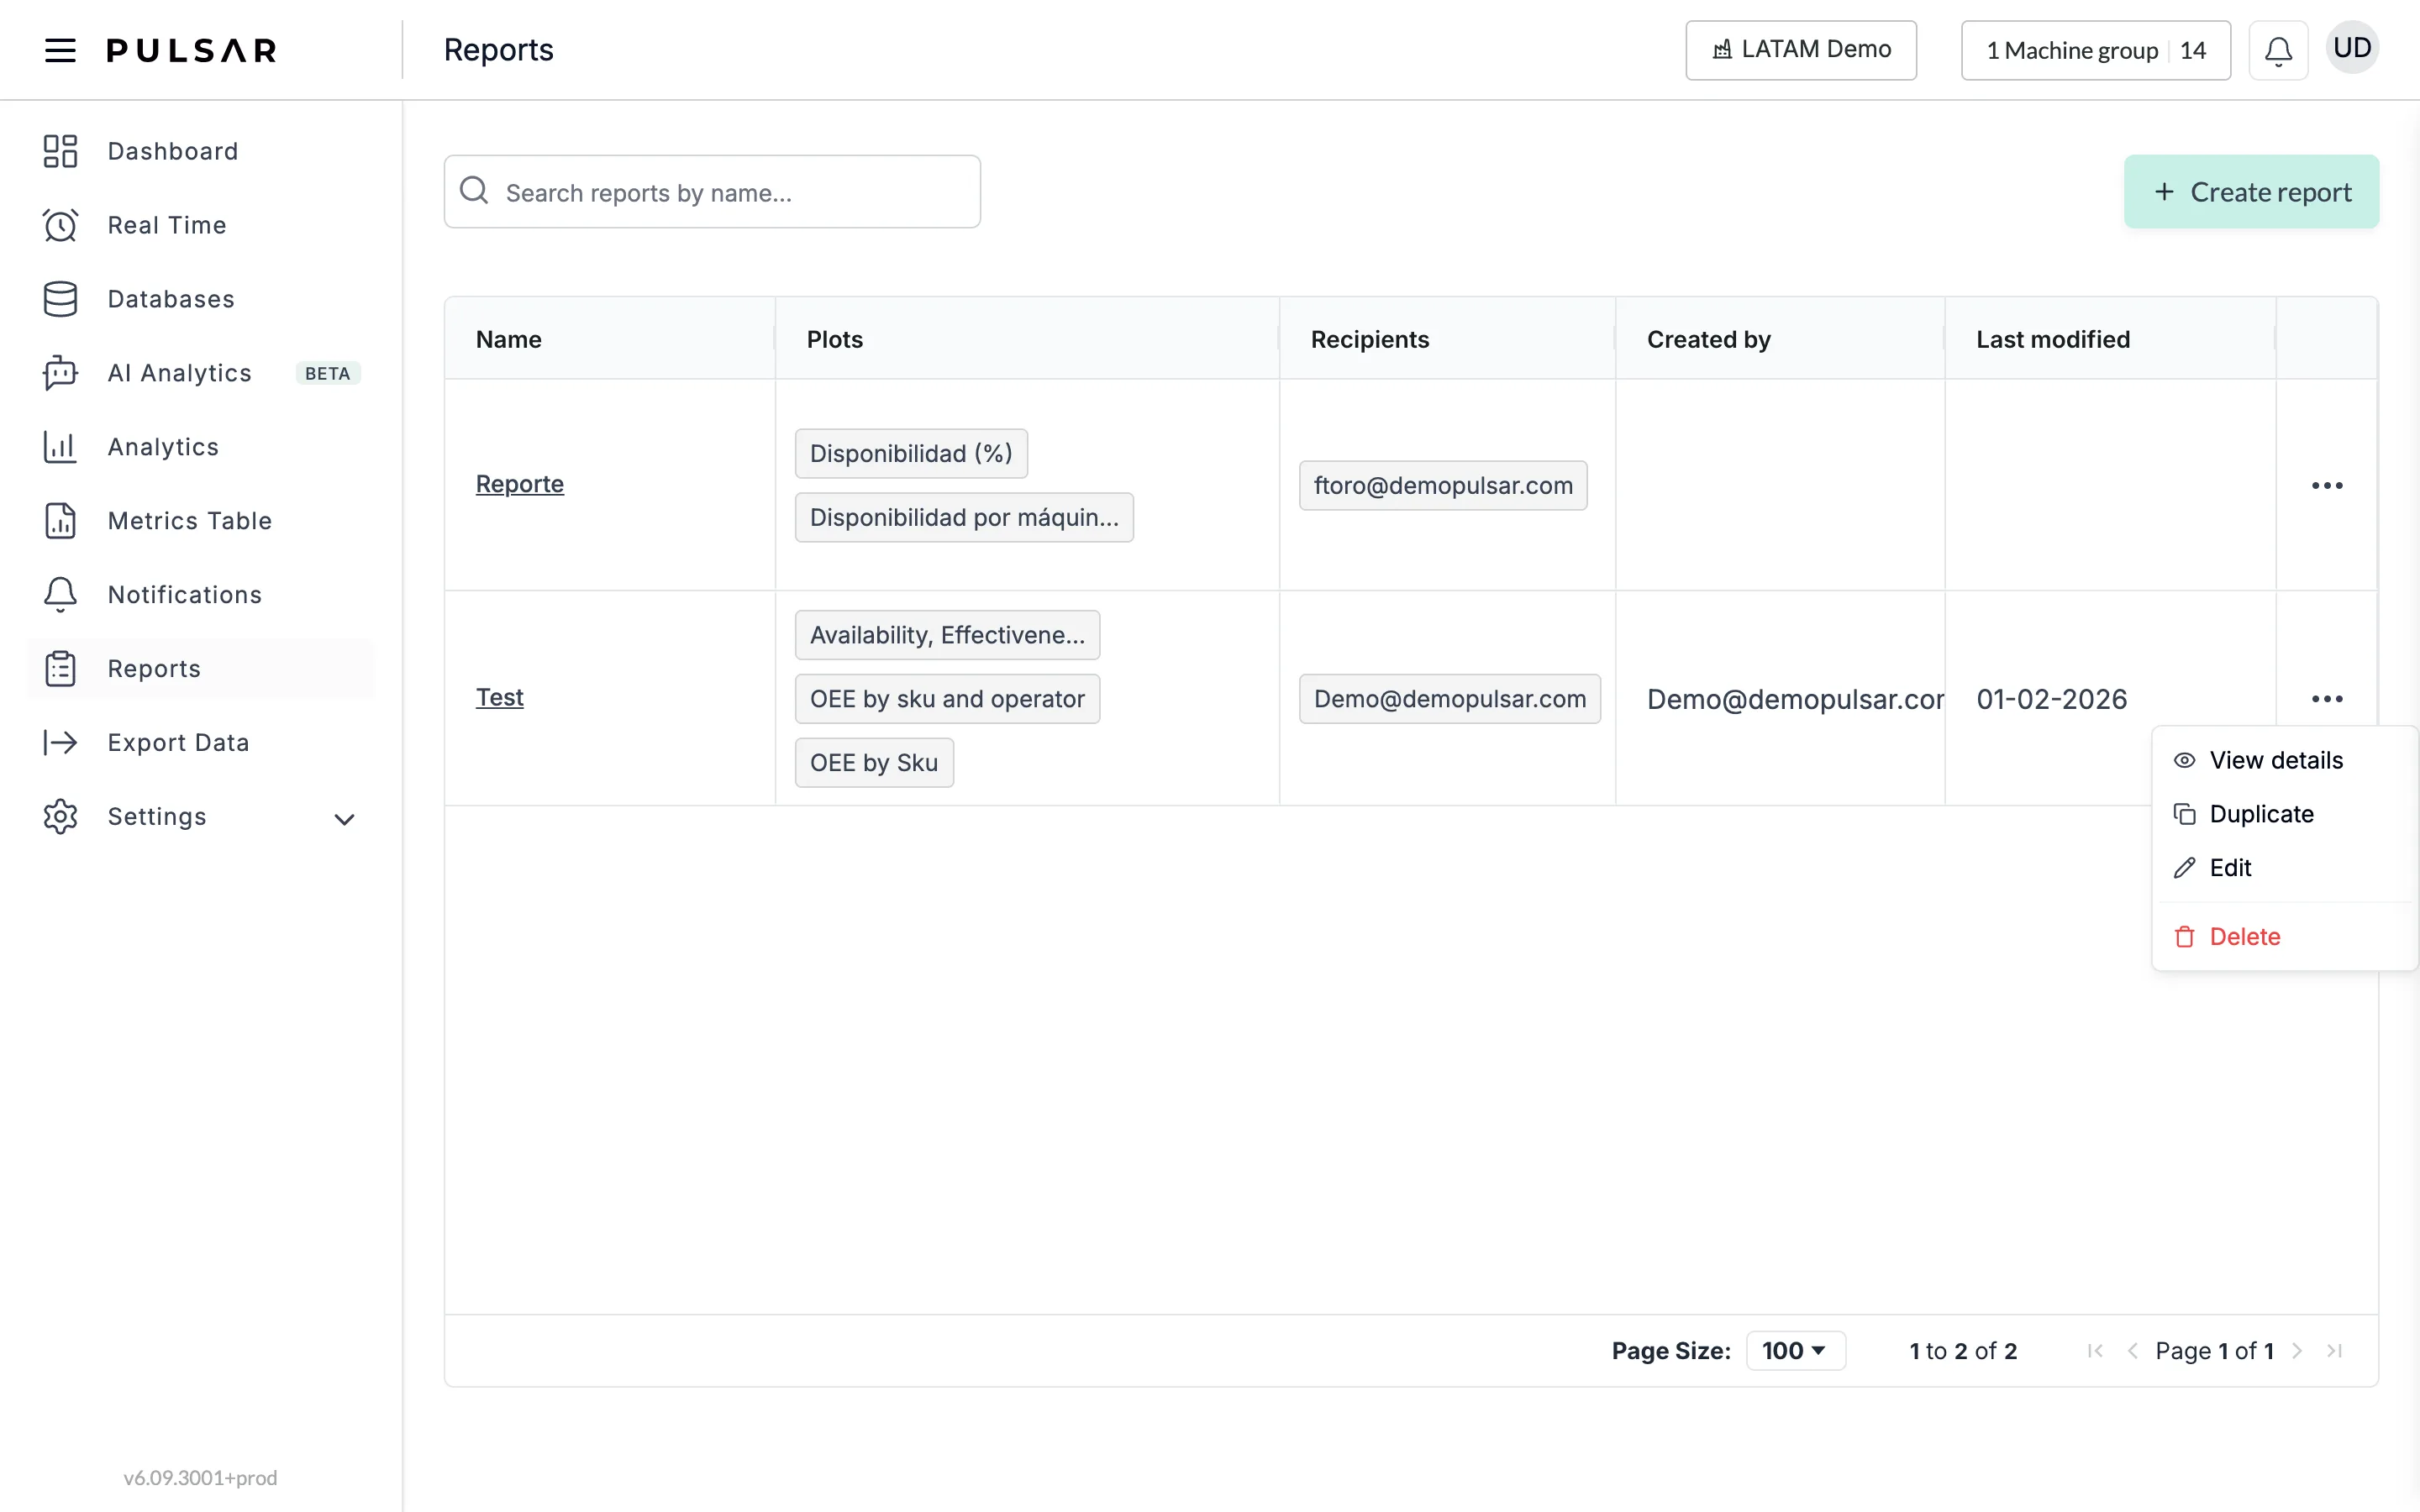
View details (or clicking the report's name) opens the report's page: who created it, when it was last modified, and its schedule (for example, "Scheduled to be sent every week on Monday at 22:45 America/Monterrey"). From there you can Delete or Edit it, or Send report now. Its tabs show the Plots and their filters, the Recipients, and the Report history: each date with its status, Pending sends you can Cancel, and Sent reports you can Download.
Before you set up a report
- Delivery time. Choose a delivery time at least one hour after the end of every shift you want to include. For example, if you need a daily report and the night shift ends at 7:00 a.m., have it delivered at 8:00 a.m. so the night shift is included. Or send it at End of shift.
- Time range of the charts. A chart's time range includes only the shifts that started within it. For example, a report for February 18 includes every shift that began on February 18.
- A common mistake. A report delivered at 7:00 a.m. with its charts set to Current day instead of Past day comes out empty: it only considers shifts that started today and also ended before 6:00 a.m. today. That is, none.
If you have trouble setting up your reports or need help, contact your Customer Success representative or raise a support ticket from the app.