Stops
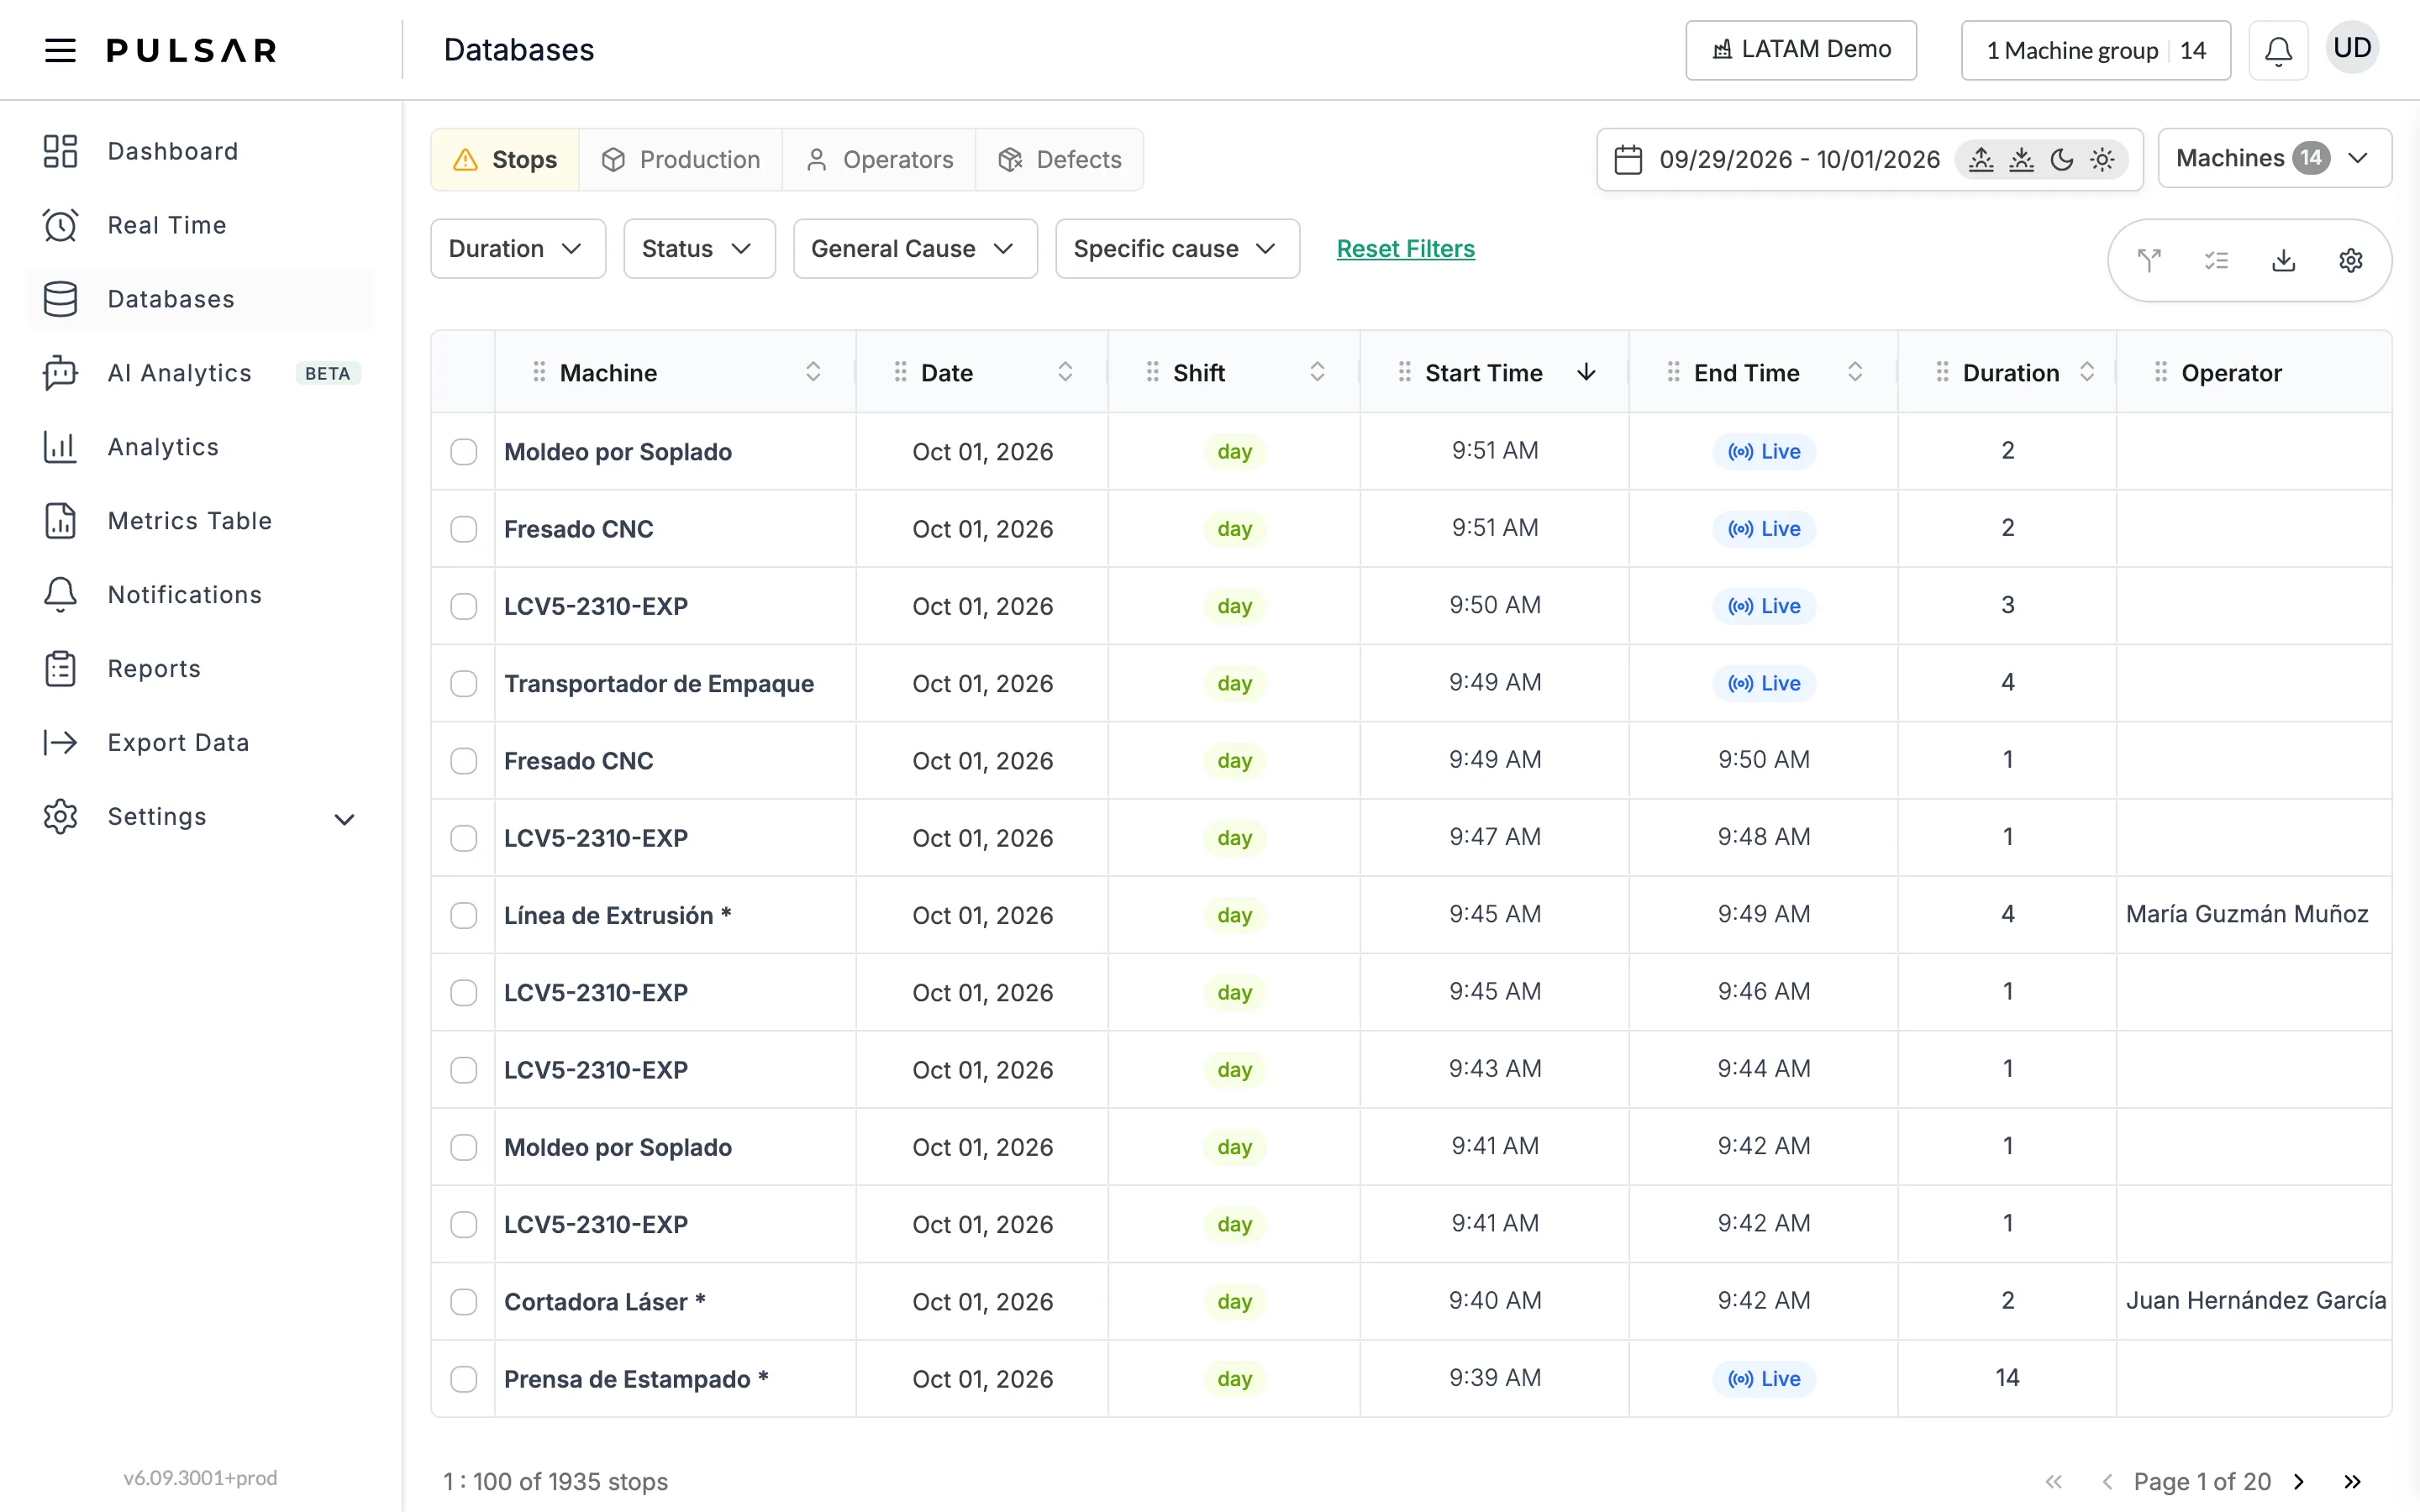
Classify, filter, split and export your machines' stops from the Stops tab in Databases on your computer.
Pulsar detects when a machine stops. Recording why it stopped, as soon as possible after it happens, is what turns that data into decisions. On your computer, you do it from Databases → Stops, which lists every stop of your machines. To classify only the current shift's stops of one machine, you can also use Annotate Stops on its card in Real Time.
Classify a stop
Choose the period and the machines
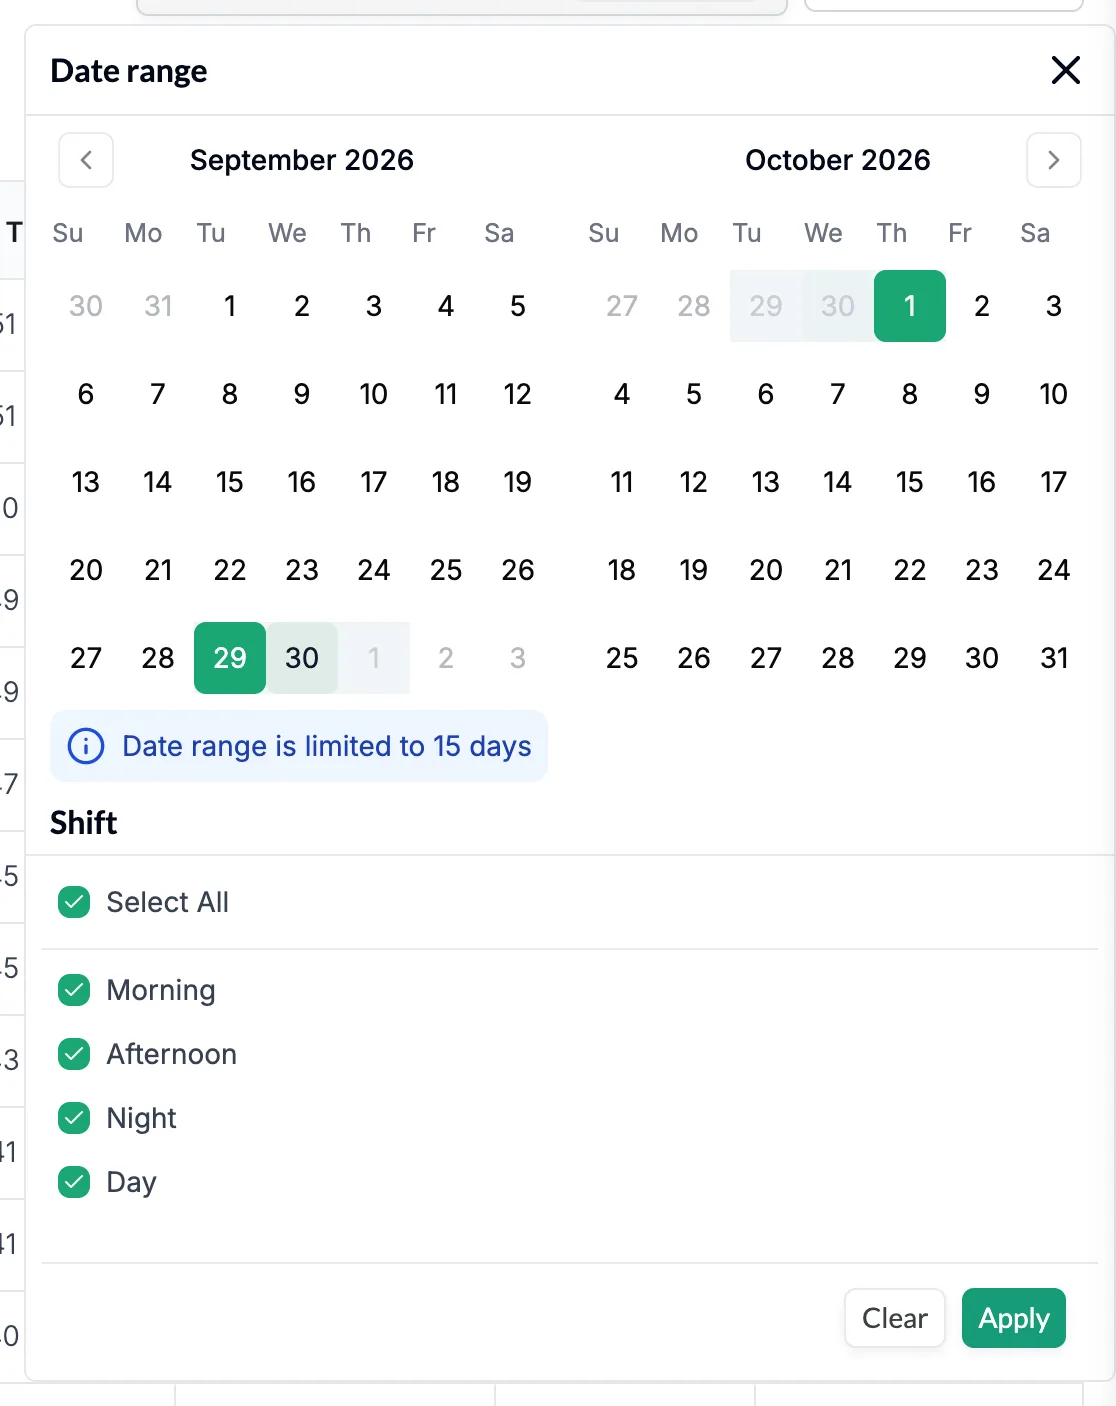
Click the date range at the top right of the page and pick the start and end dates on the calendar, up to 15 days. Under Shift, untick any shifts you don't want to see, then click Apply. Next to it, Machines chooses which machines are listed.
Fill in the cause
In the table, click a stop's General Cause or Specific cause and choose its value from the list, or click Description and type one. Stops still in progress show Live as their end time.
The options come from your stop catalog. If you haven't set up a catalog and assigned it to the machine yet, do that first in Settings → Stops.
There's no Save button: the classification is recorded as you choose it. It feeds several of Pulsar's dashboards, and other users and devices, such as the tablets on the floor, see it too.
Choose how many days tablets show
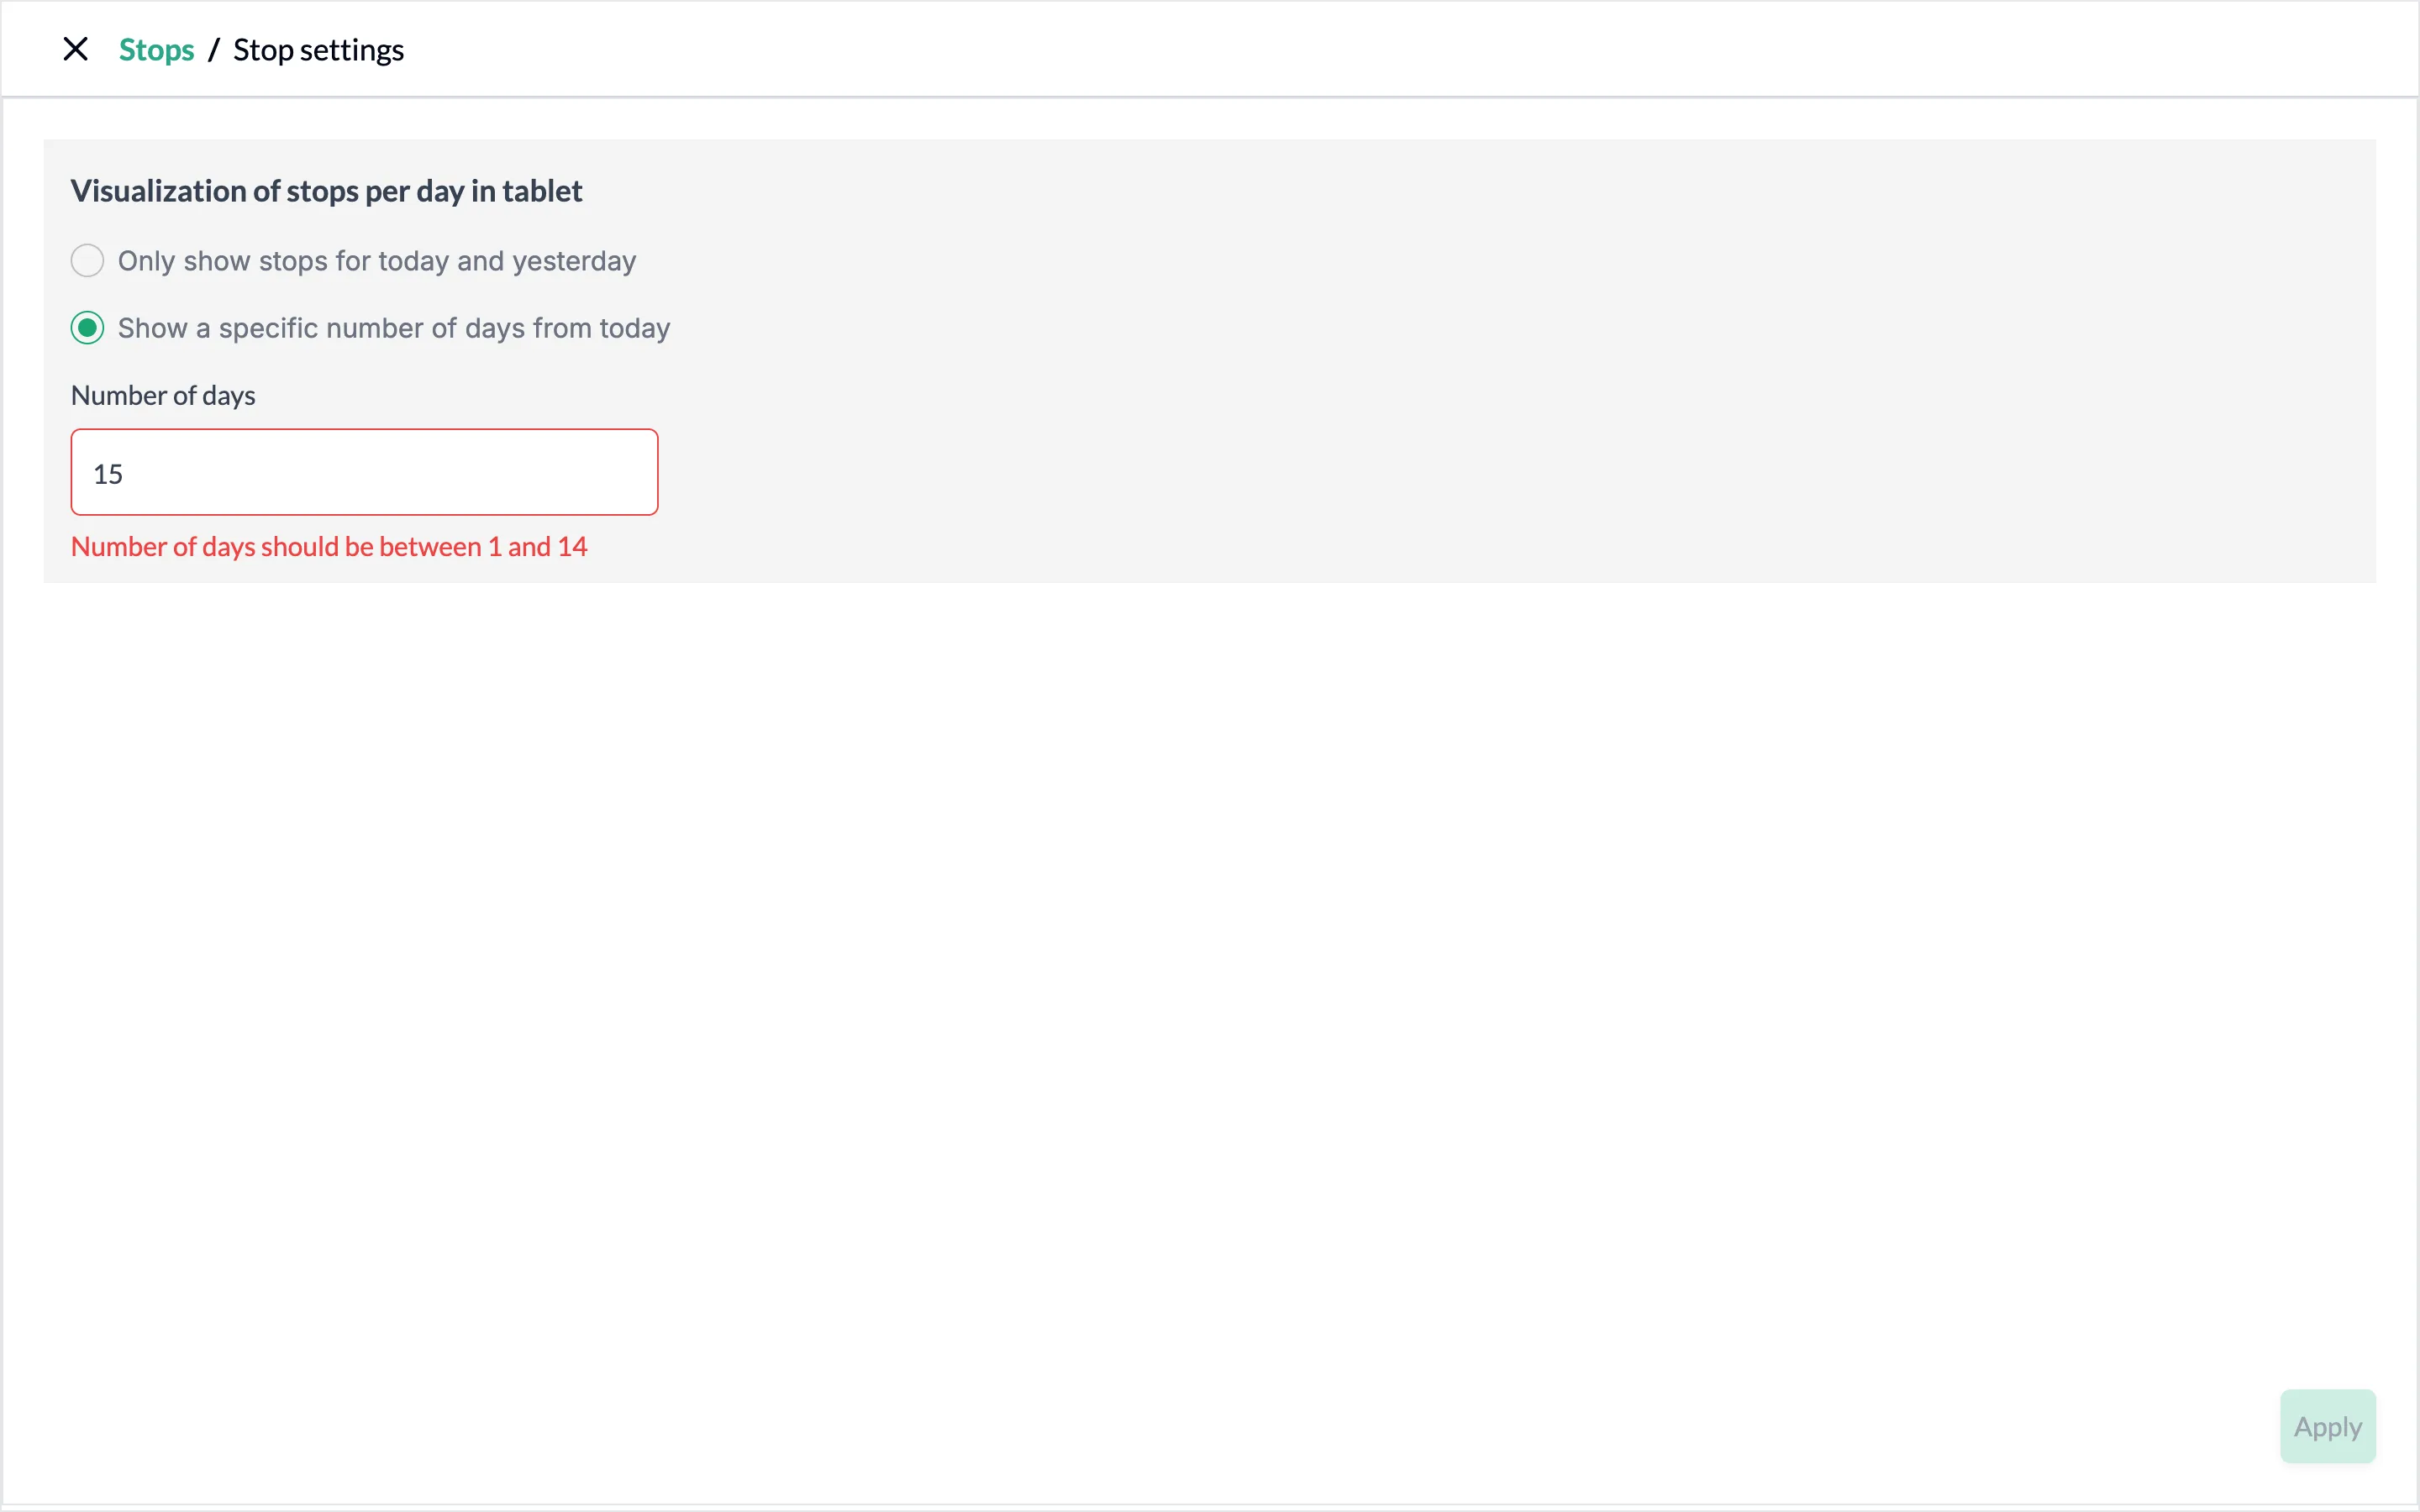
Click the gear icon, Settings, at the right end of the icons above the table. Stop settings opens, where Visualization of stops per day in tablet chooses which stops the tablets list:
- Only show stops for today and yesterday
- Show a specific number of days from today, with the Number of days between 1 and 14.
Click Apply to save, or the X at the top left to close without changes.
We recommend today and yesterday. Loading less data makes the tablet faster, and it discourages classifying stops several days late.
This setting applies to the whole account: a change is reflected for every user.
Filter stops
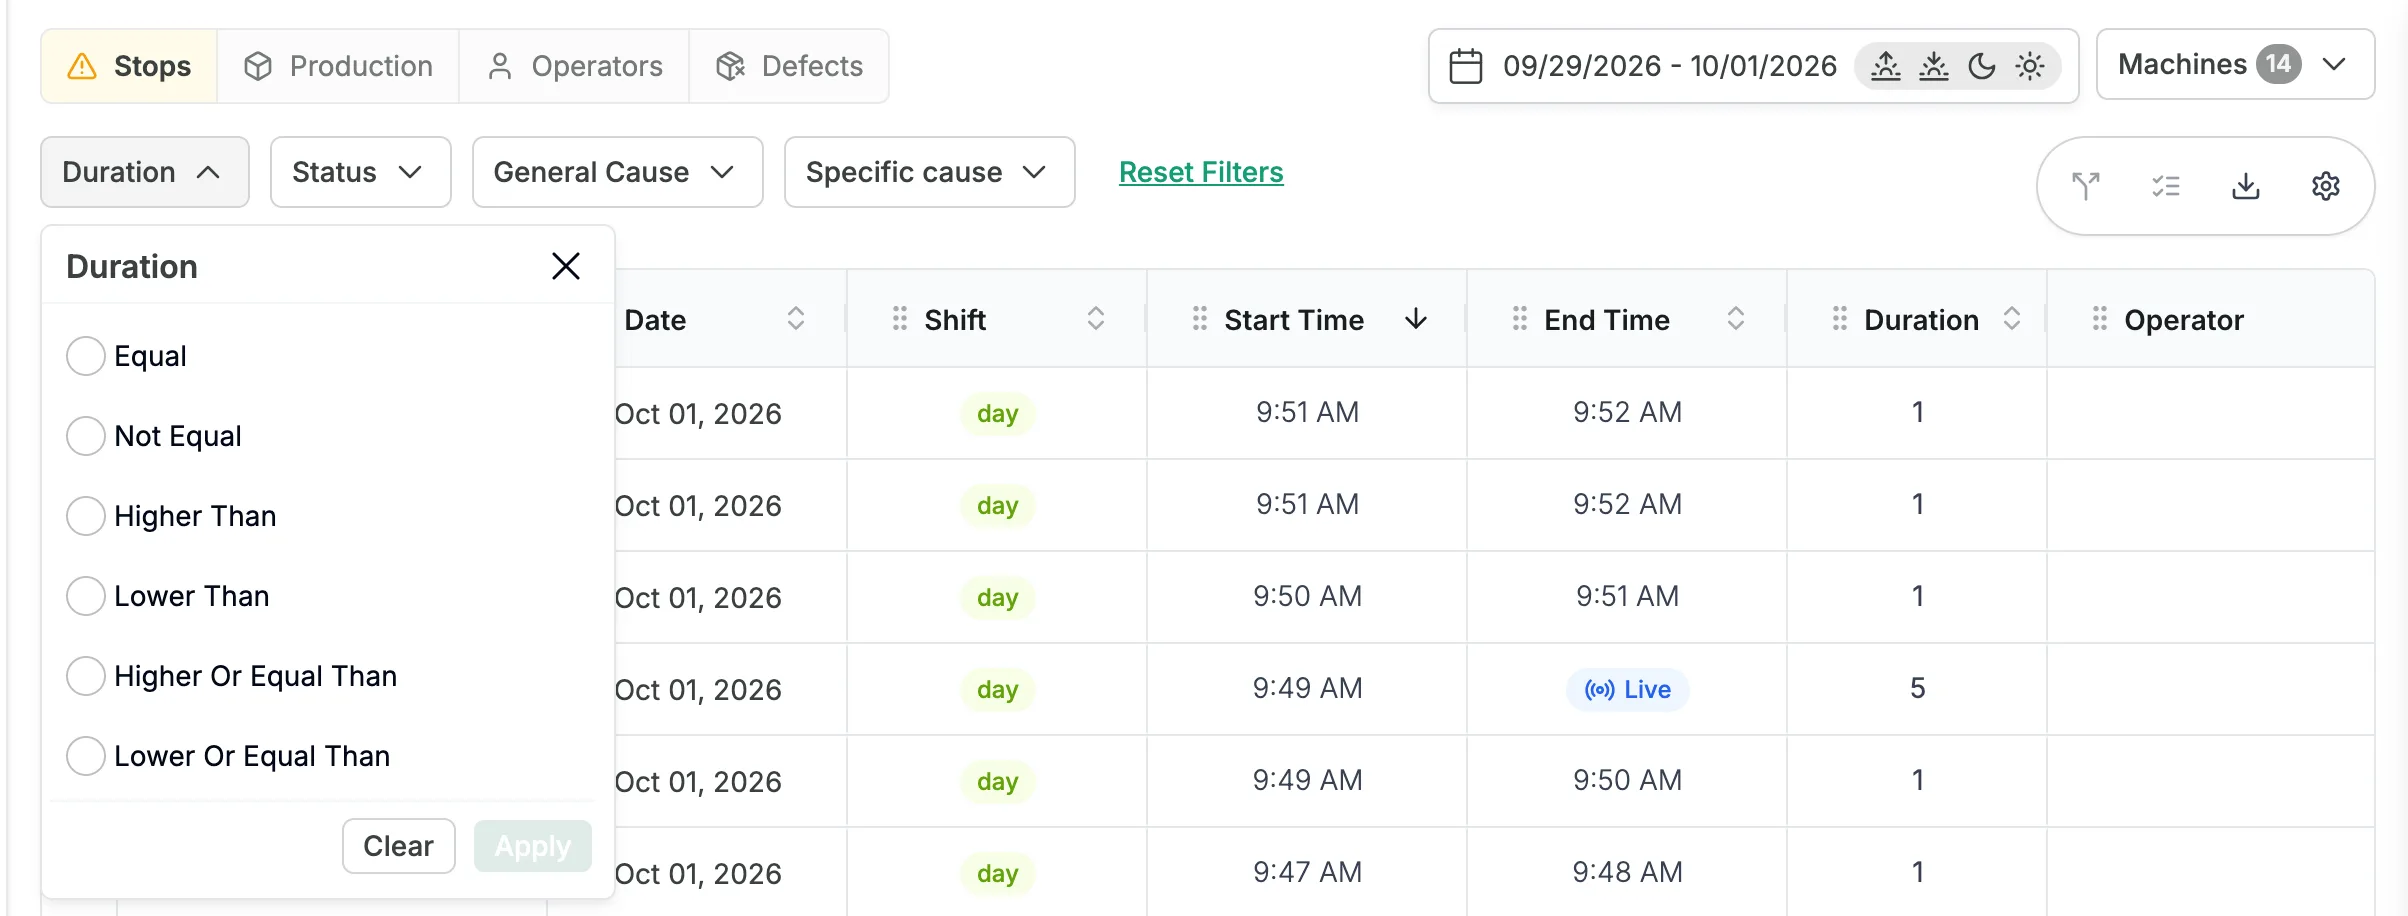
Use the filters above the table to narrow down the data, then click Apply in each one:
- Duration: stops whose duration, in minutes, is Equal, Not Equal, Higher Than, Lower Than, Higher Or Equal Than or Lower Or Equal Than a value.
- Status: Concluded Stops or Ongoing Stops.
- General Cause and Specific cause: the causes you tick. General Cause also has Unclassified, to find the stops still pending.
Reset Filters clears them all.
Sort stops
Click a column heading, such as Start Time or Duration, to sort the table by it, and click again to reverse the order. The arrow next to the heading shows the current order. The table shows 100 stops per page; use the arrows at the bottom right to change page.
Split a stop
A long stop can have more than one cause. Split it so each part gets its own classification.
Select the stop with its checkbox. The Split Stop icon, the first of the icons above the table, becomes available. It only works with a single stop selected, and that stop has to last more than a minute: each part of a split is at least one minute long.
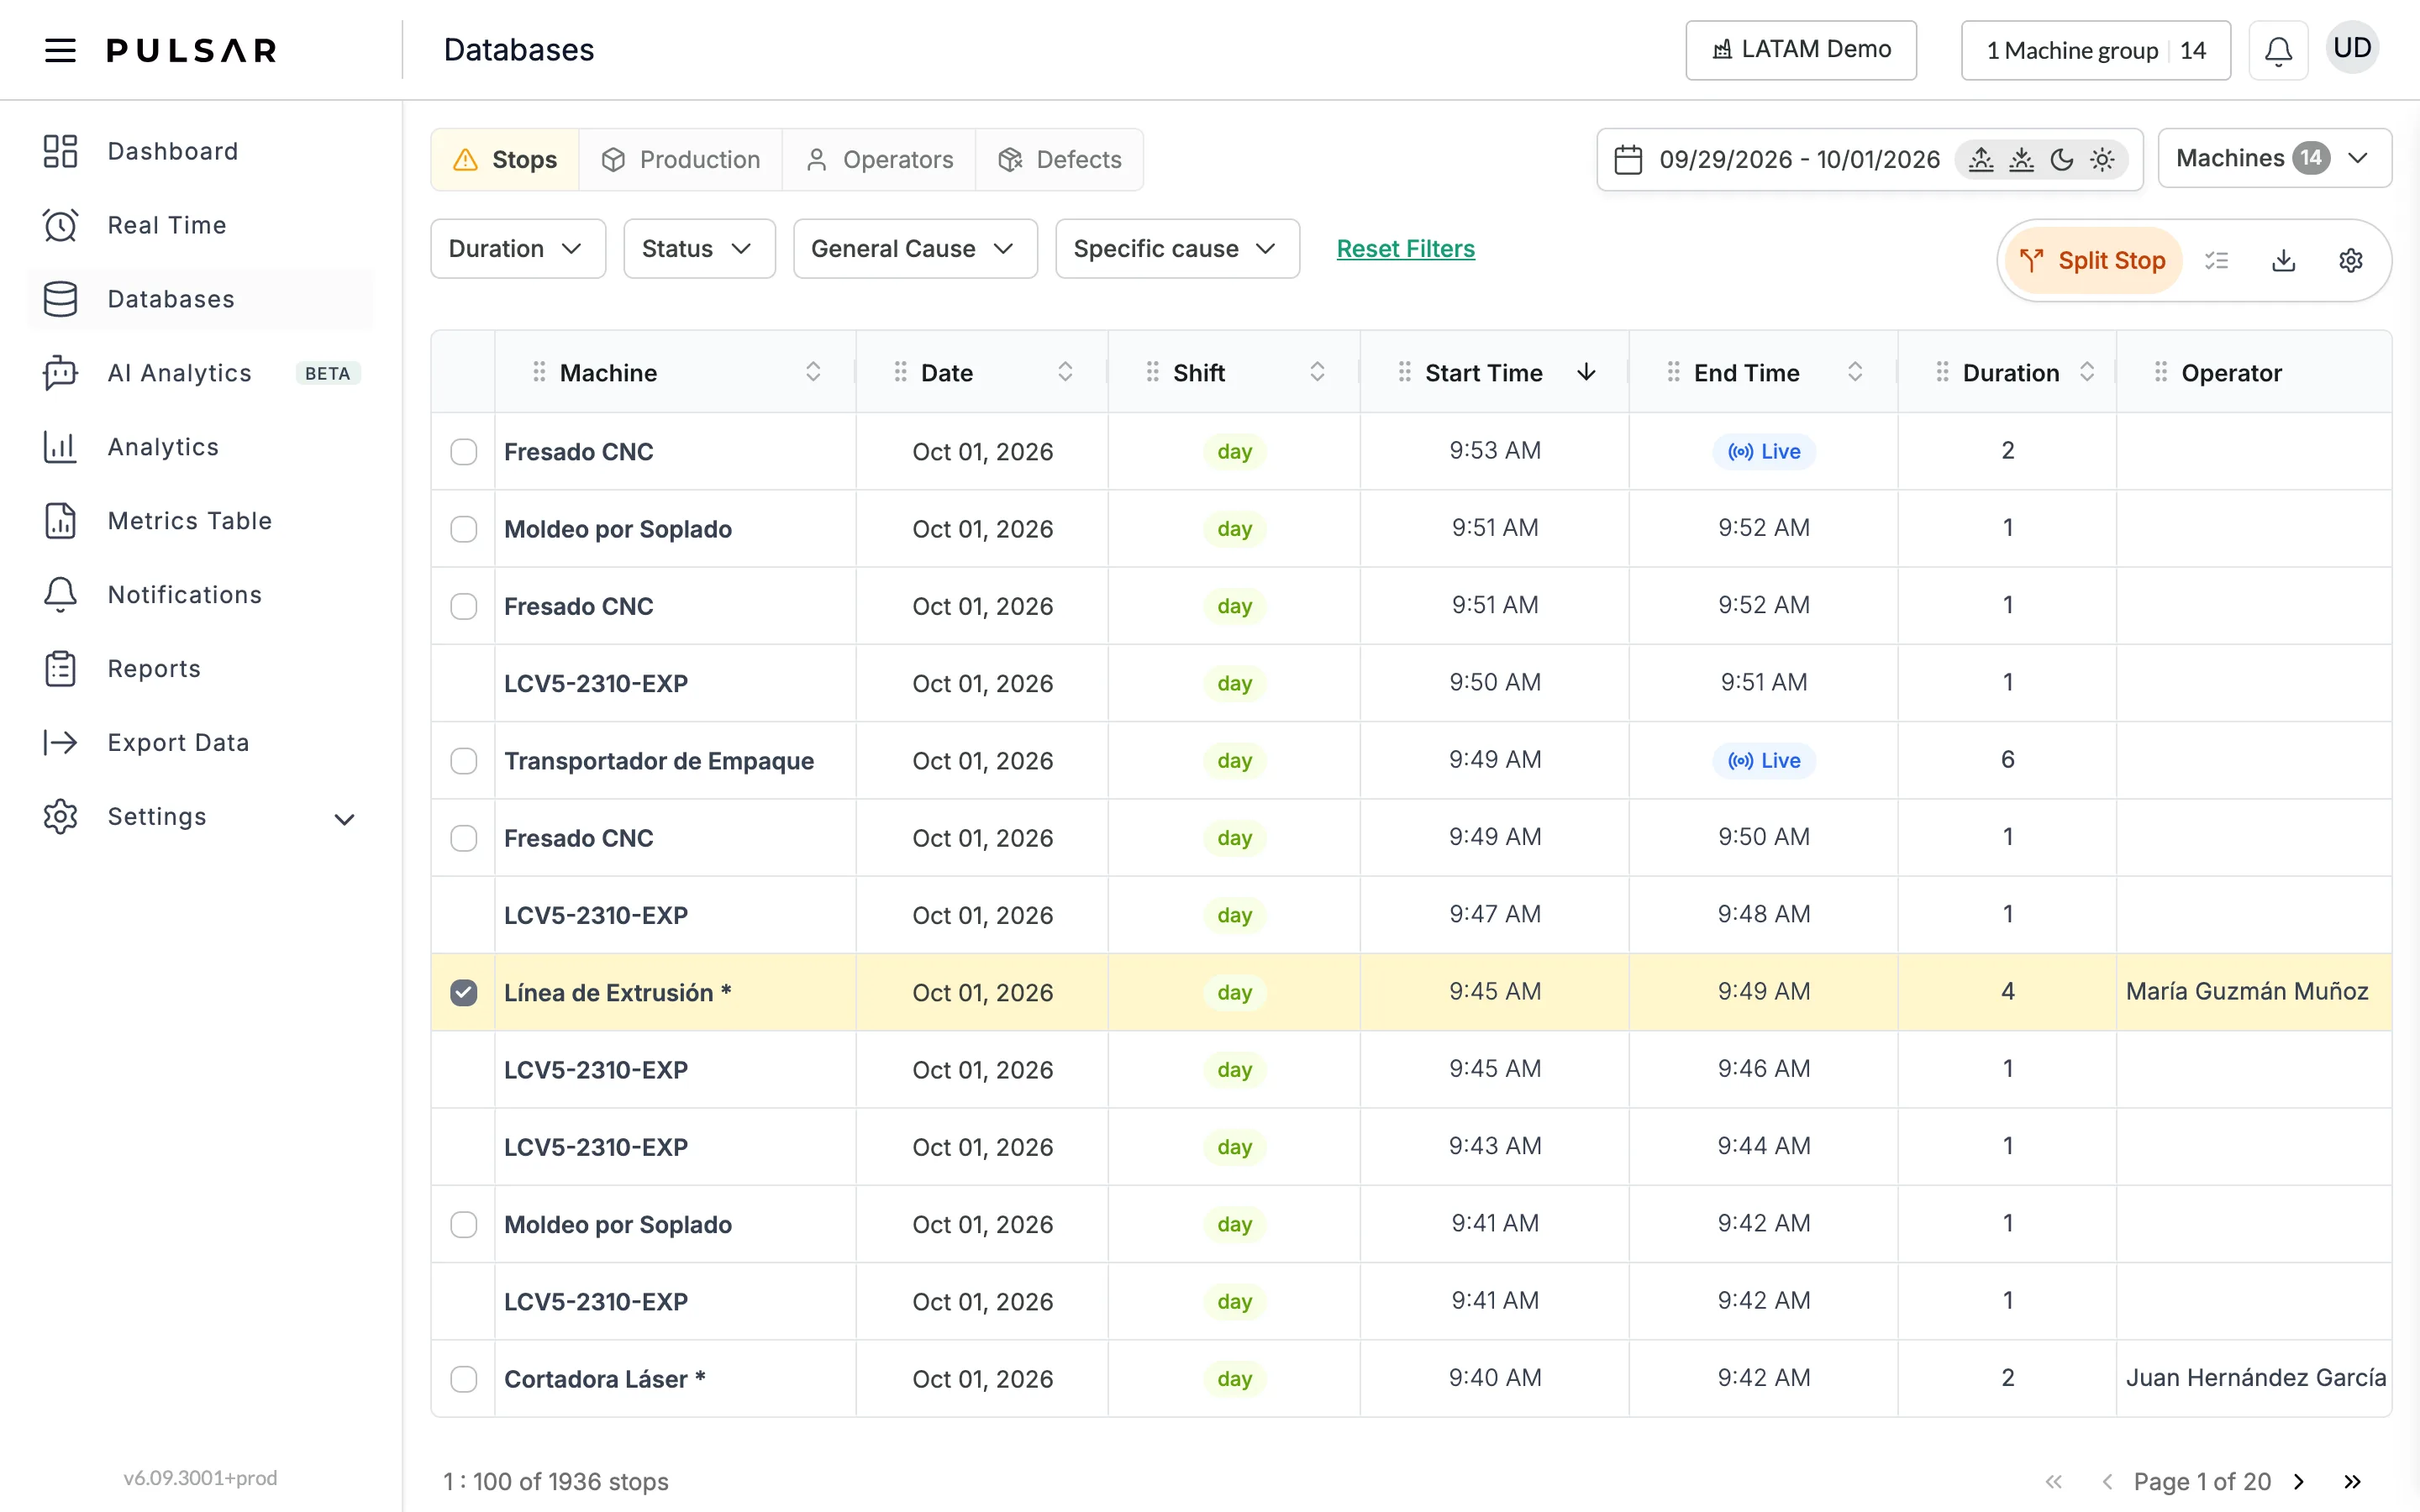
Click it. The Split Stop dialog shows the stop's Start Time and End Time. Click + to add a time in between where the stop splits, and again for each further split. − removes one.
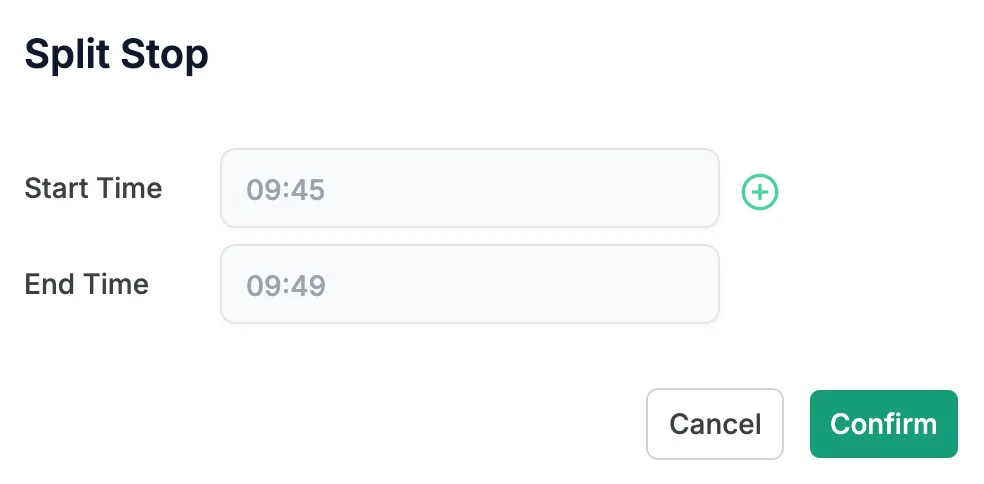
Click Confirm. The stop is now two or more stops in the table, and you can classify each with a different cause.
Classify several stops at once
When several stops share the same cause, classify them all in one go.
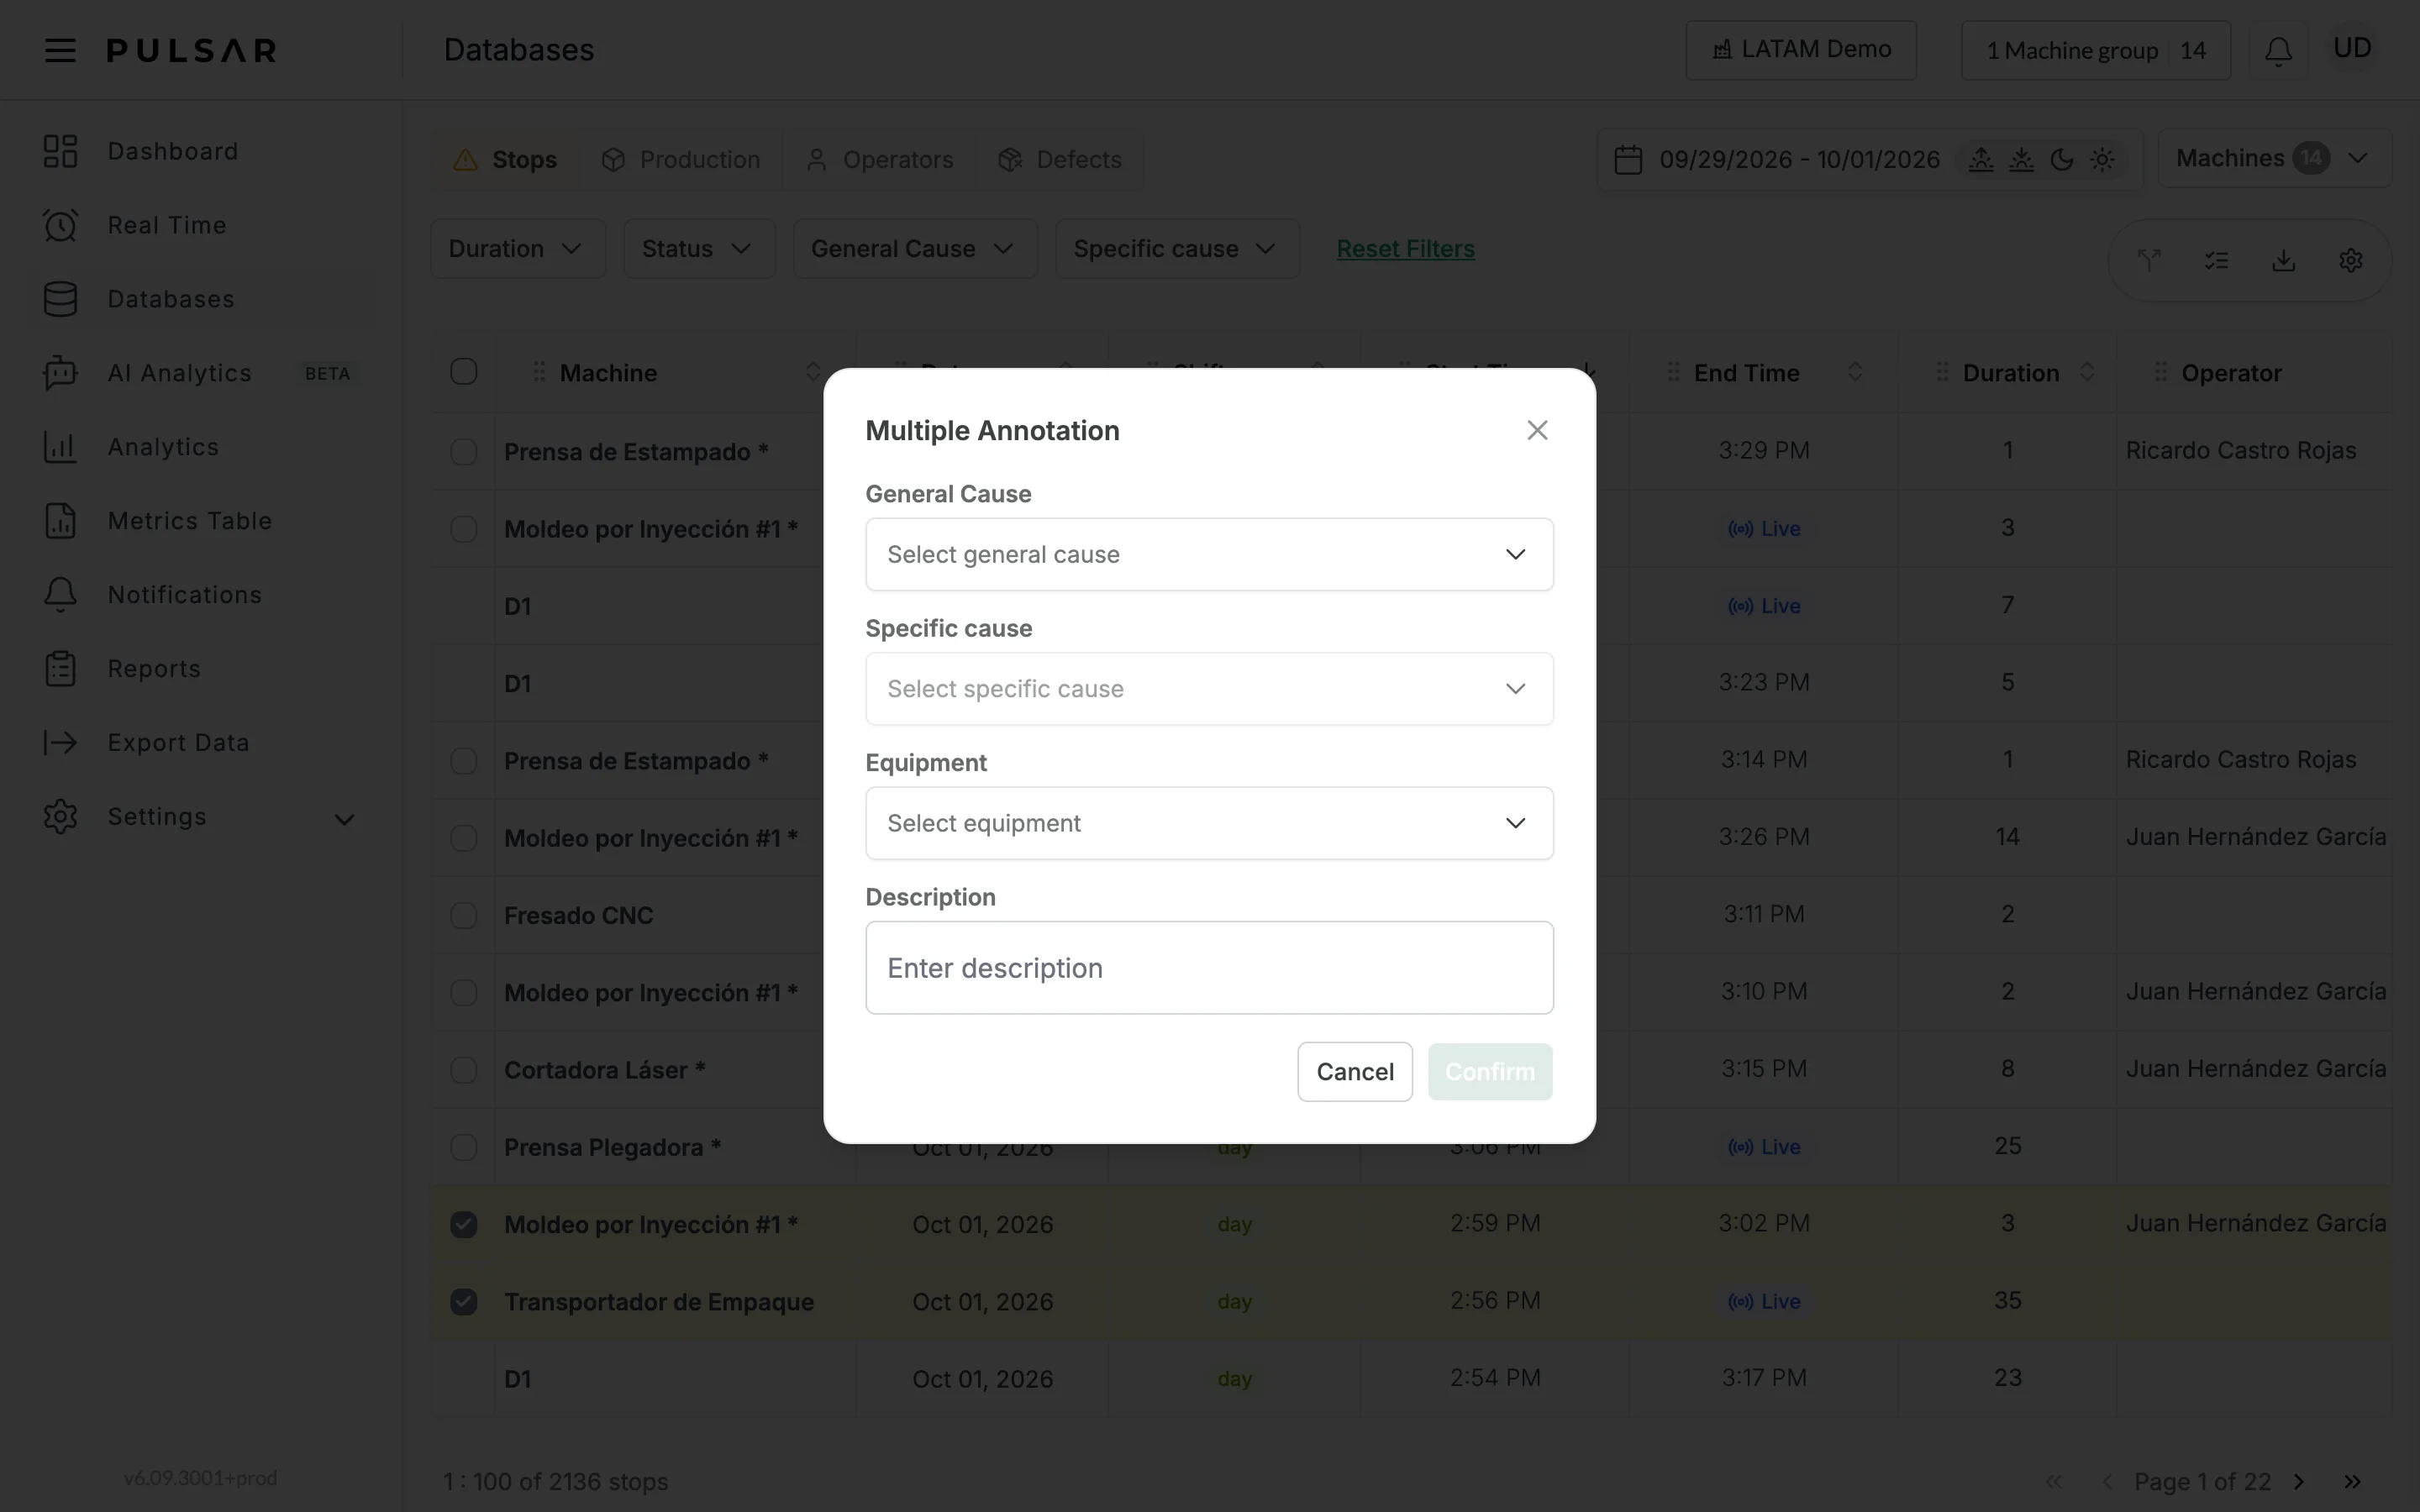
- Select at least two stops with their checkboxes. The Multiple Annotation icon, next to Split Stop, becomes available.
- Click it and choose the General Cause, the Specific cause and, if you use it, the Equipment. You can also enter a Description.
- Click Confirm.
Export stops
Click the Download icon, above the table, to download a CSV of the stops listed for the period and machines you chose. Its columns are in the same order as the table's.
If you have trouble with stops or need help, contact your Customer Success representative or raise a support ticket from the app.