Alerts
Create alerts on machine metrics, choose who receives them or how machines are highlighted, and review the notifications they generate.
Alerts react when a machine metric meets a condition you define. An alert can send a message to the people you choose, paint the machine in a color on the Real Time and TV views, or both. This page explains how to create alerts, set their conditions, manage recipients, and review the notifications they generate.
Video
Open the alerts settings
As a Pulsar admin, go to Settings > Alerts. The Alert Settings page has two tabs: Set Alerts, where you create and manage alerts, and Recipients, where you manage who receives them.
Create an alert
On the Set Alerts tab, click Create New Alert. The alert form opens, with three sections: Metric, Conditions and Notification.
In Metric, choose the Metric the alert is based on and the Machines it applies to. The list includes Stop Time and the sensor variables your machines measure, such as temperature or vibration.
For Stop Time, you can narrow the alert to certain stops: choose a Stop annotation type (General Cause, Specific cause, Equipment or Unclassified) and one or more values in Stop Label. For example, to trigger the alert only for stops classified under quality.
In Conditions, set when the alert is triggered. The options depend on the metric:
- Stop Time: in When the metric is over, enter a threshold number and choose Minutes or Hours. For example, only when a stop exceeds 120 minutes.
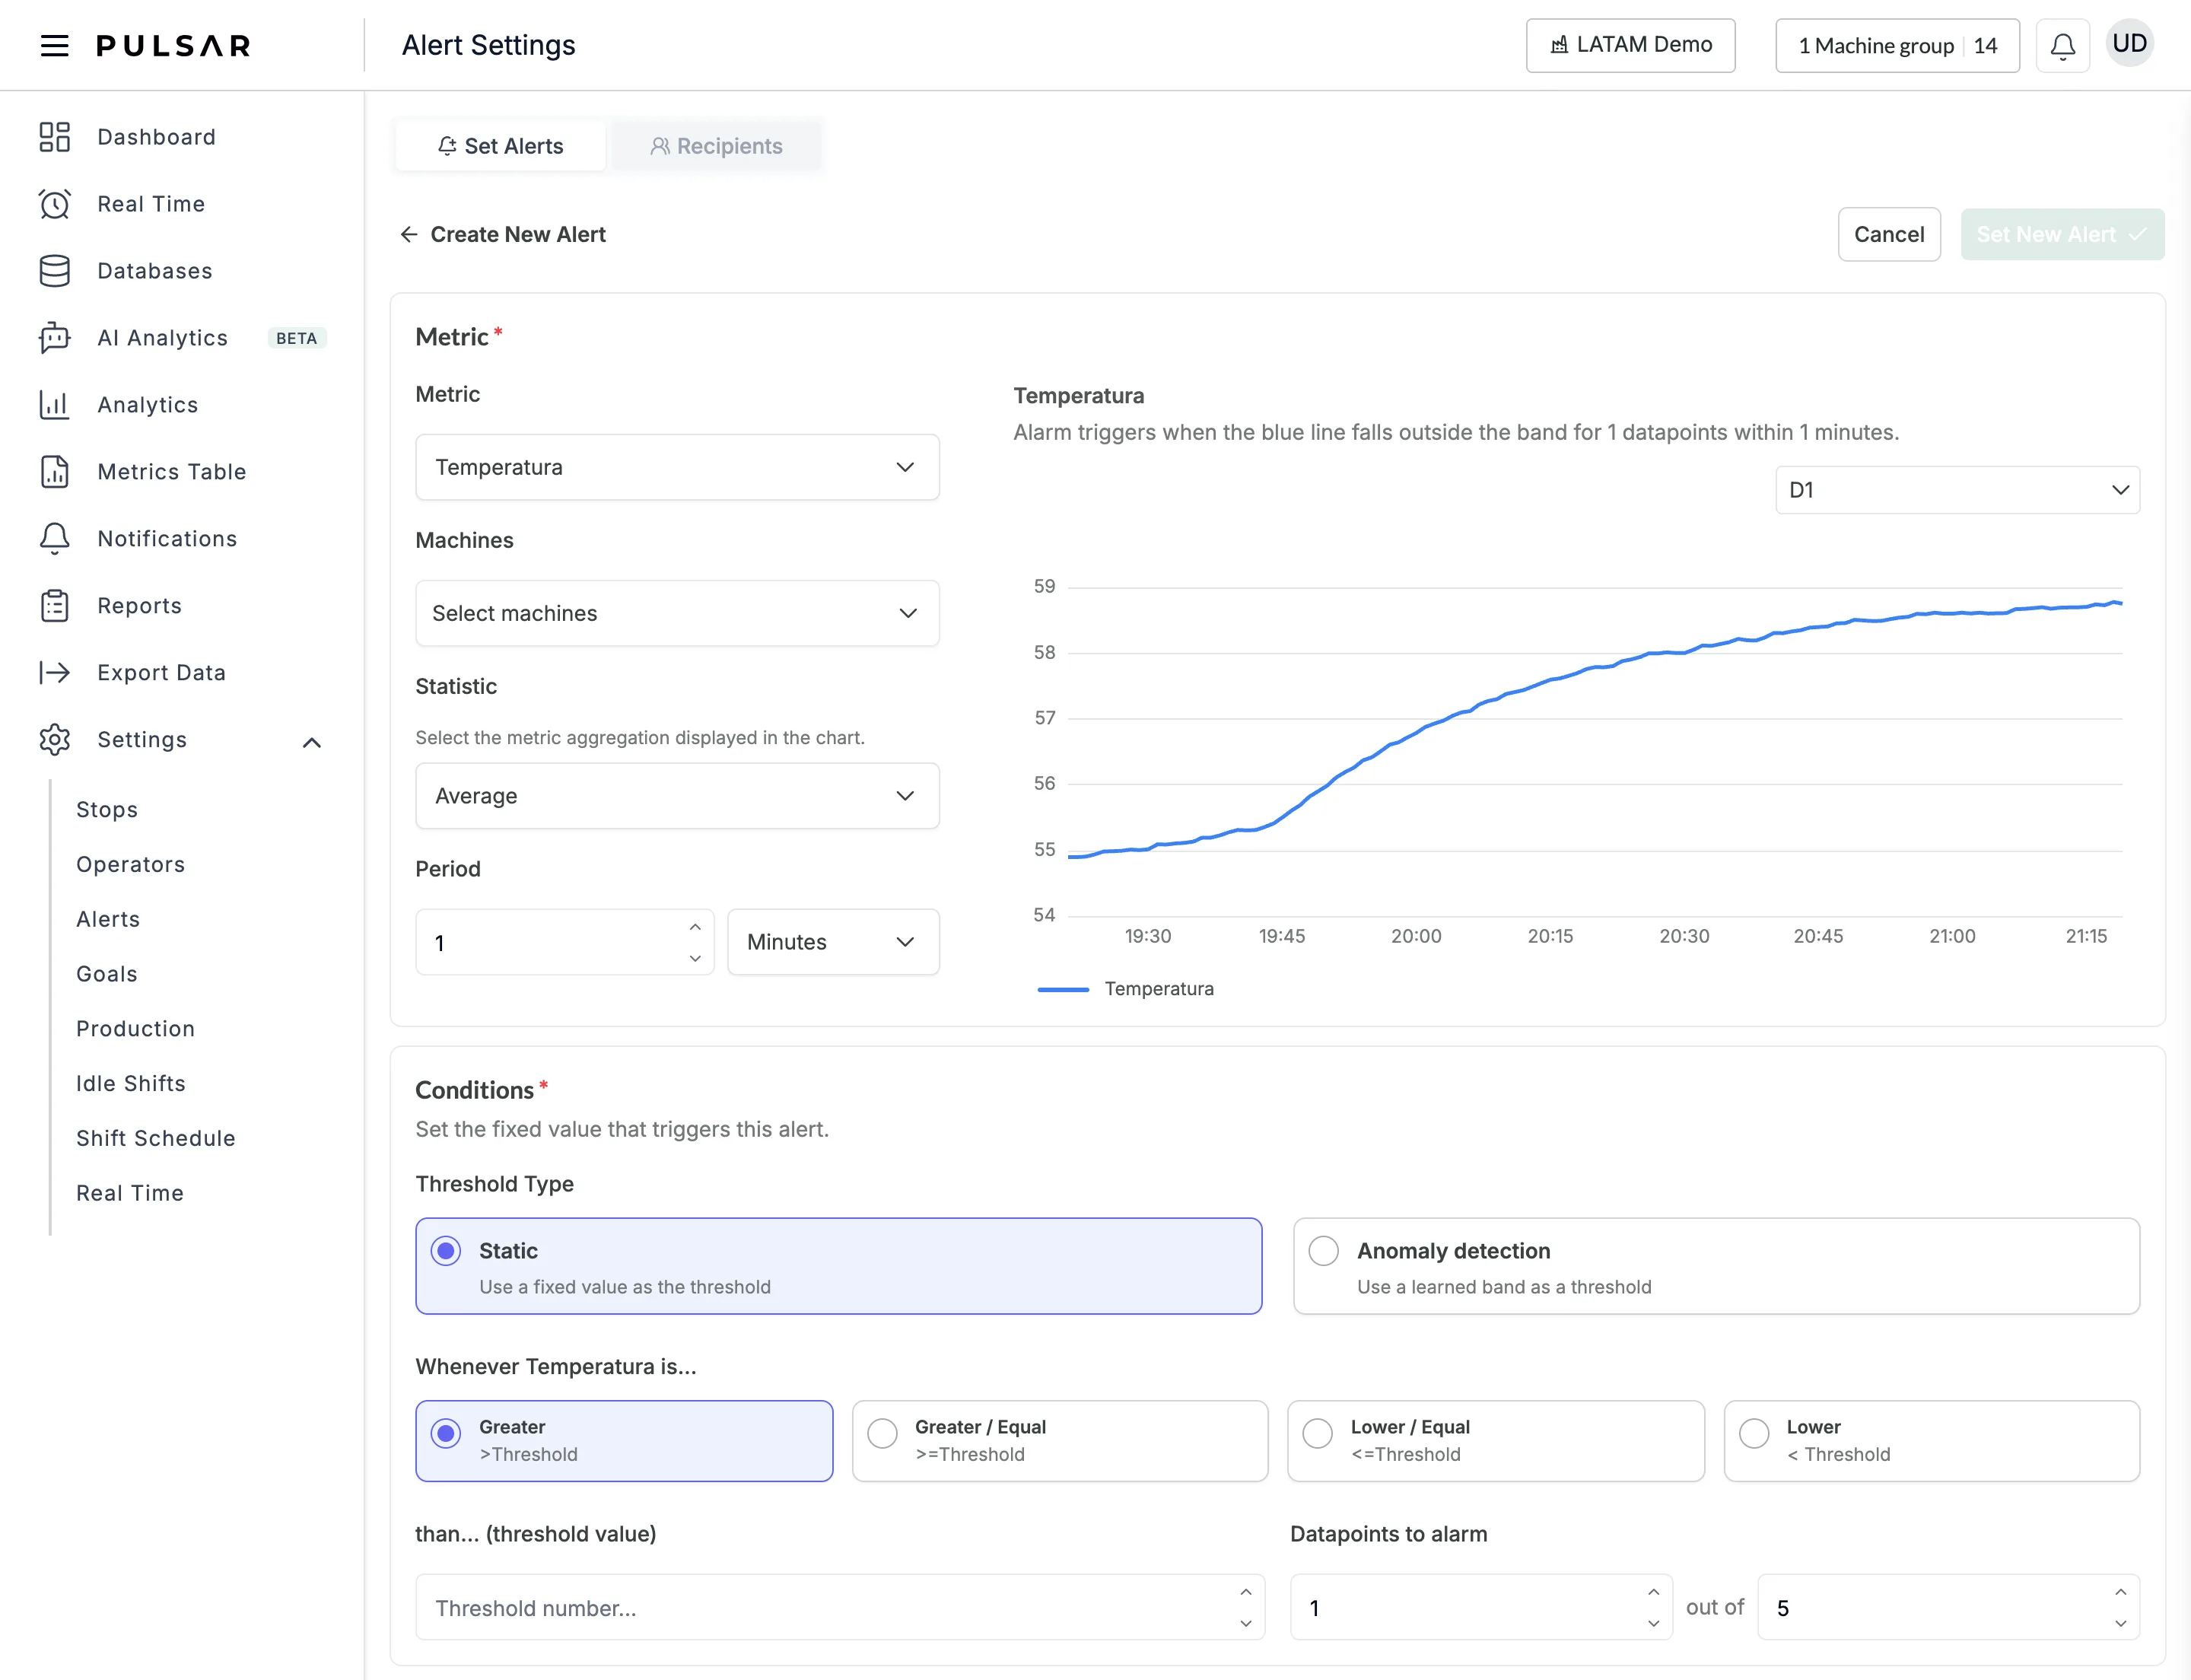
- A sensor variable: choose the Statistic (Average, Sum, Min or Max) and the Period in Minutes or Hours. A chart next to them shows the machine's recent values. Under Threshold Type, keep Static (a fixed value), choose the comparison under "Whenever variable is..." (Greater, Greater / Equal, Lower / Equal or Lower), enter the value in than... (threshold value), and set Datapoints to alarm: how many datapoints out of how many must break the threshold.
Anomaly detection (a learned band as the threshold) isn't enabled by default. If you're interested, the app asks you to contact support.
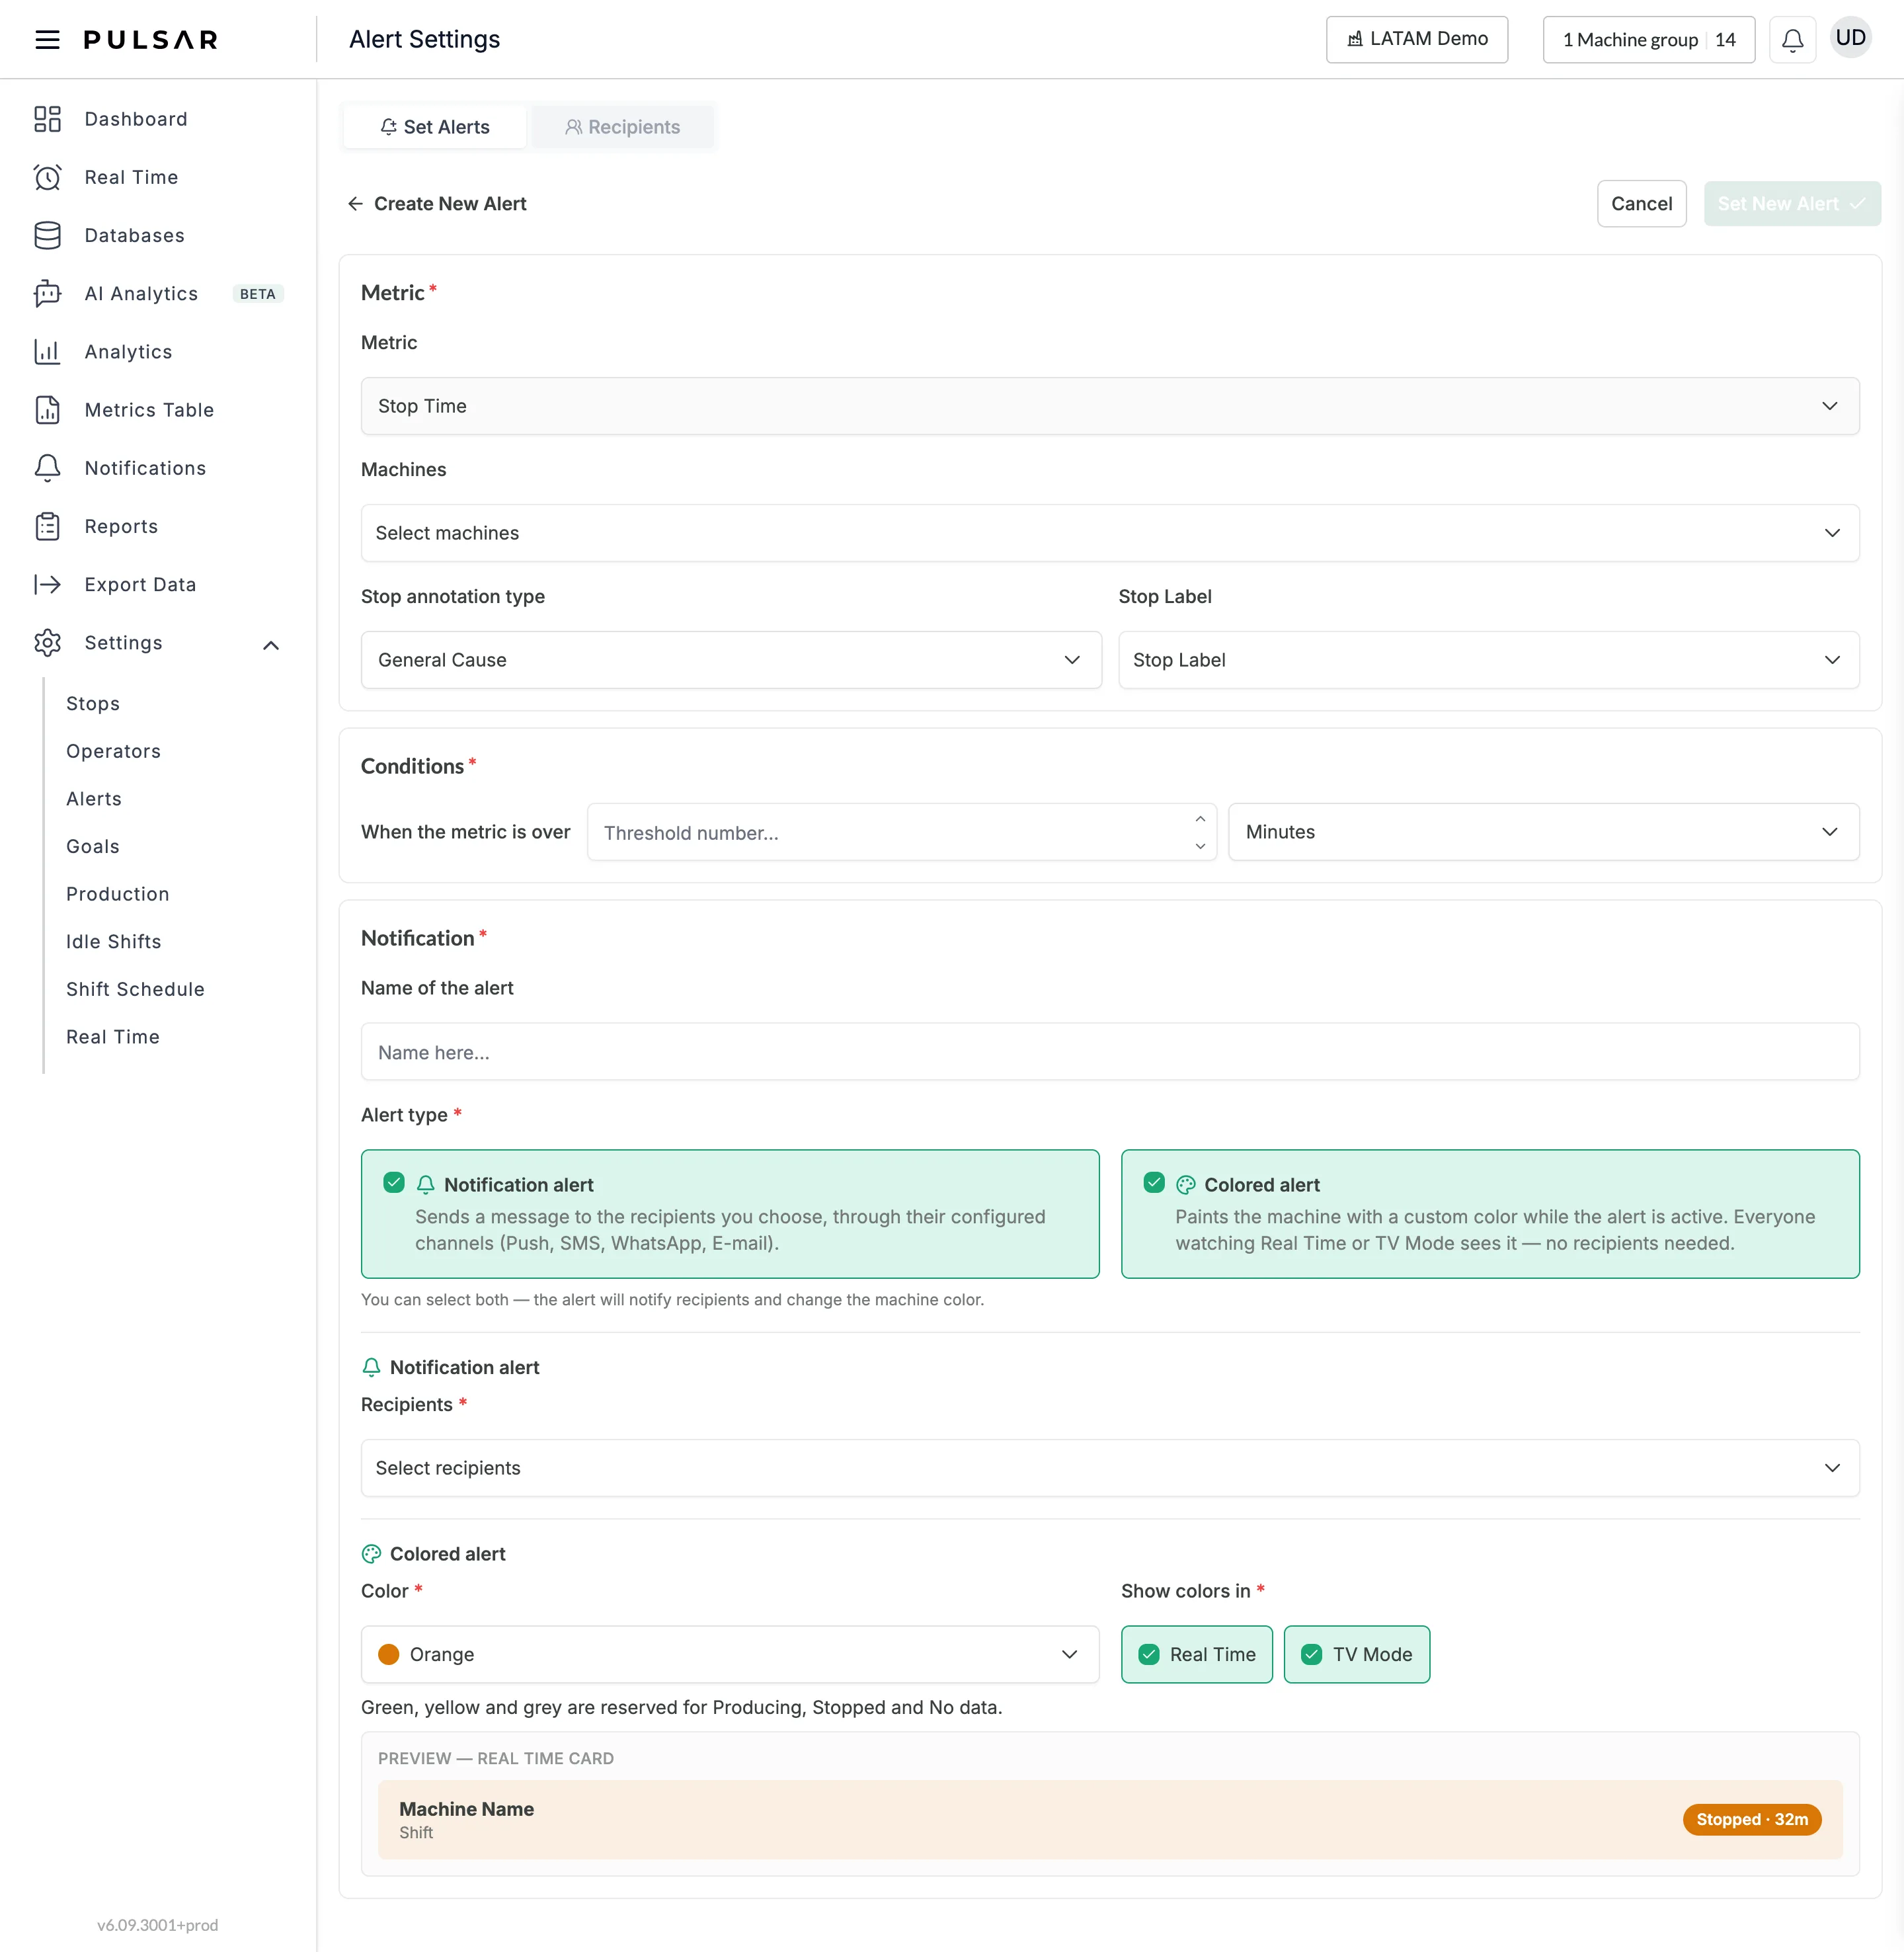
In Notification, give the alert a Name of the alert and choose the Alert type. You can select one or both:
- Notification alert: sends a message to the Recipients you choose, through the channels each one has turned on (Push, SMS, WhatsApp, E-mail).
- Colored alert: paints the machine in a Color (Orange, Light Blue, Fuchsia, Violet or Red) while the alert is active. Under Show colors in, choose Real Time, TV Mode or both. Everyone watching those views sees it, so it needs no recipients. Green, yellow and grey aren't available, because they're reserved for Producing, Stopped and No data. A preview shows how the Real Time card will look.
Click Set New Alert to save it, or Cancel to leave without saving.
Manage your alerts
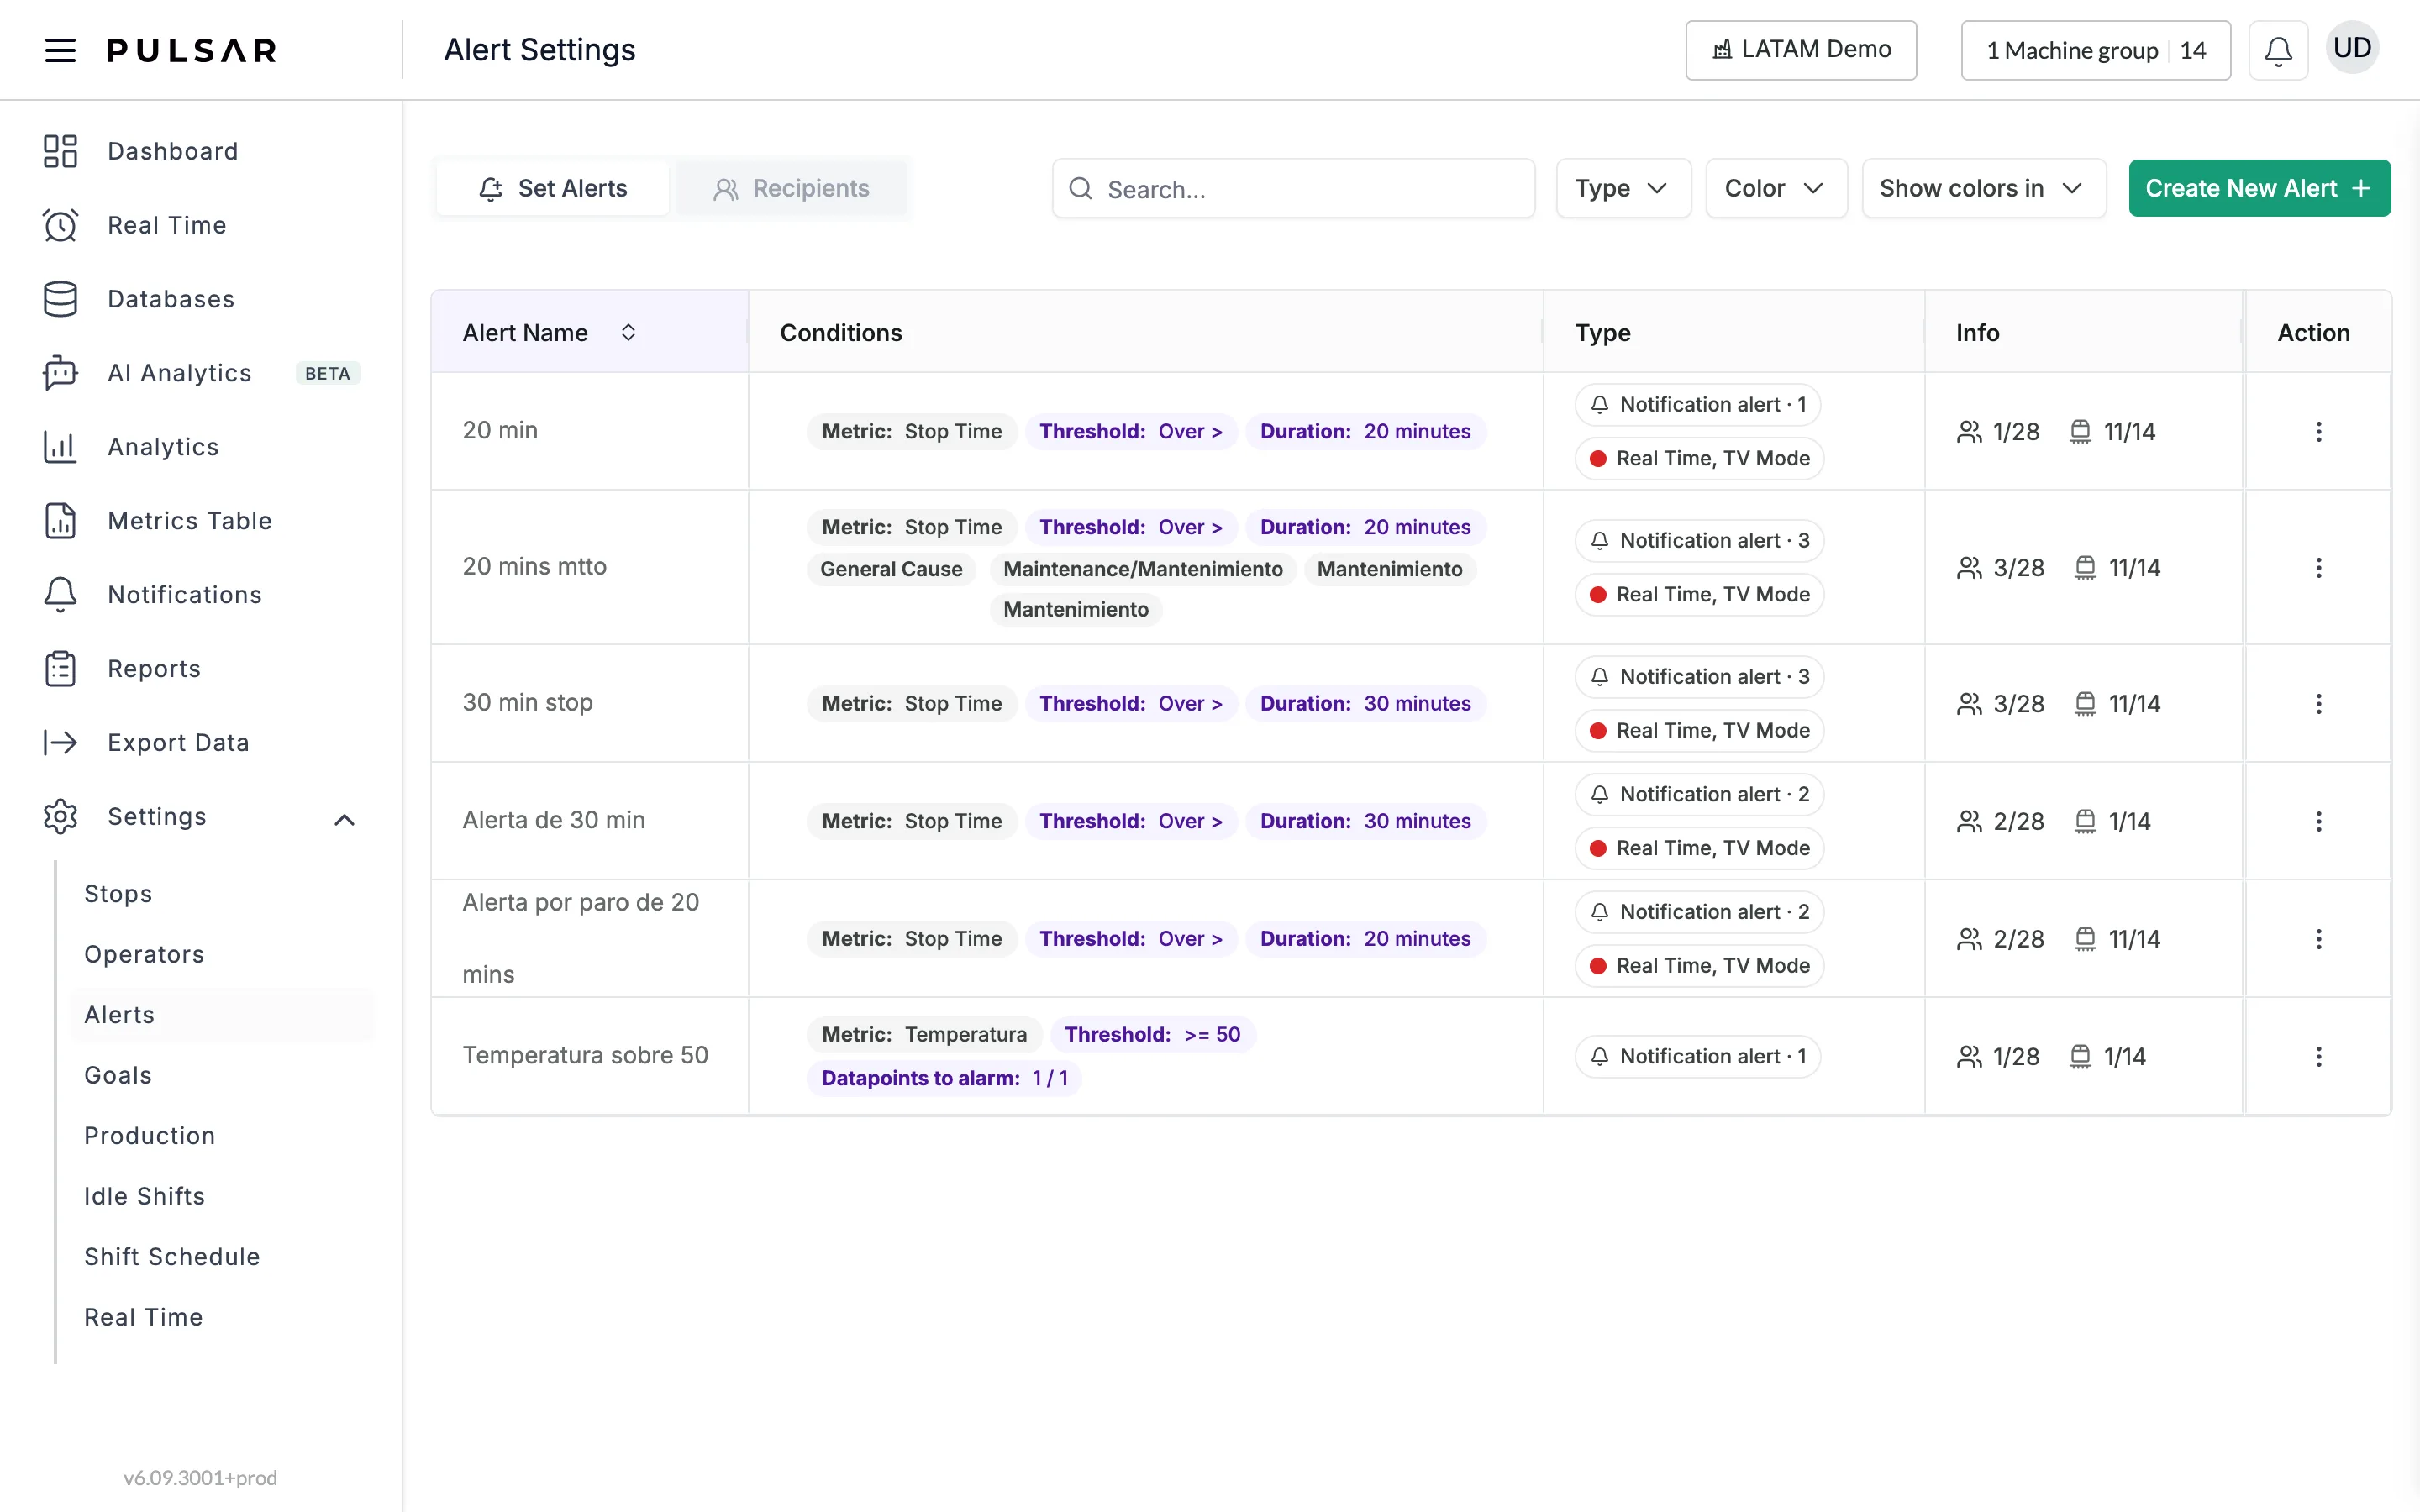
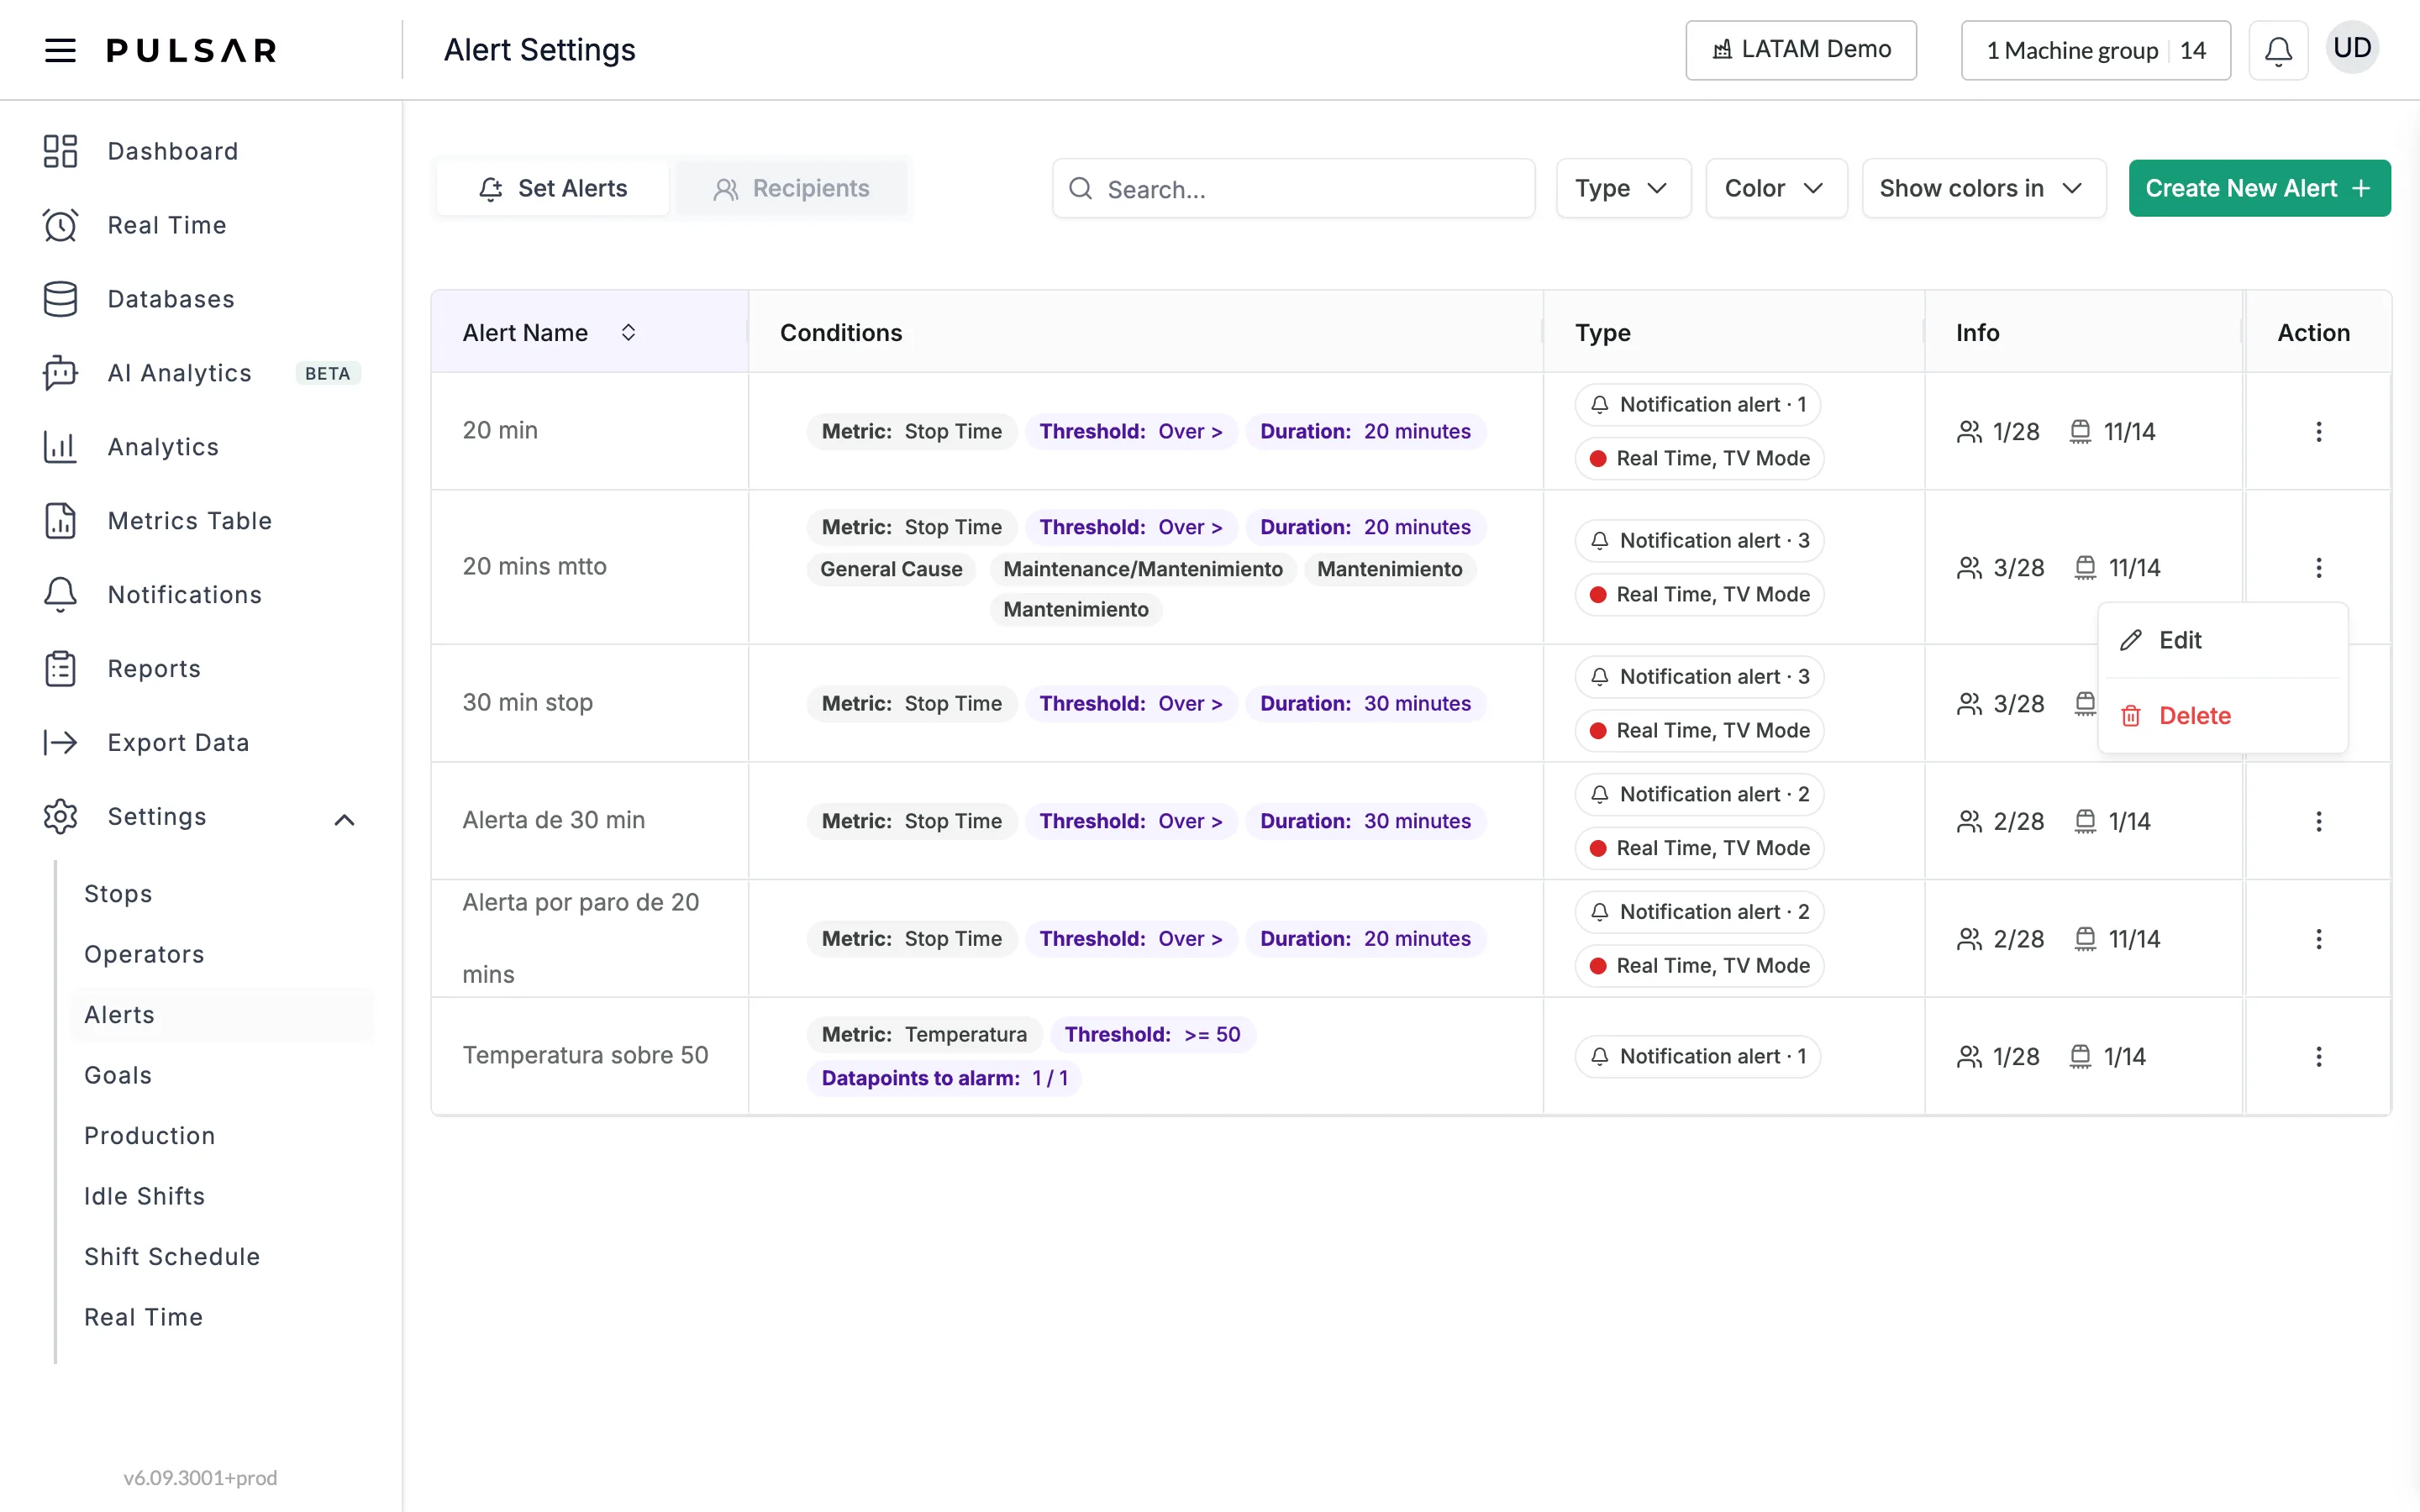
Every alert you create appears in the list on the Set Alerts tab, which shows:
- Alert Name: the name you gave it
- Conditions: the metric, threshold, duration and any stop labels
- Type: Notification alert with its number of recipients, and the views a colored alert is shown in, with its color
- Info: how many users and how many machines are assigned to it
Click the three dots (⋮) on an alert to Edit or Delete it. To find a specific alert, use the search bar, or filter the list by Type (Notification alert or Colored alert), by Color, or by Show colors in (Real Time or TV Mode).
Edit recipients
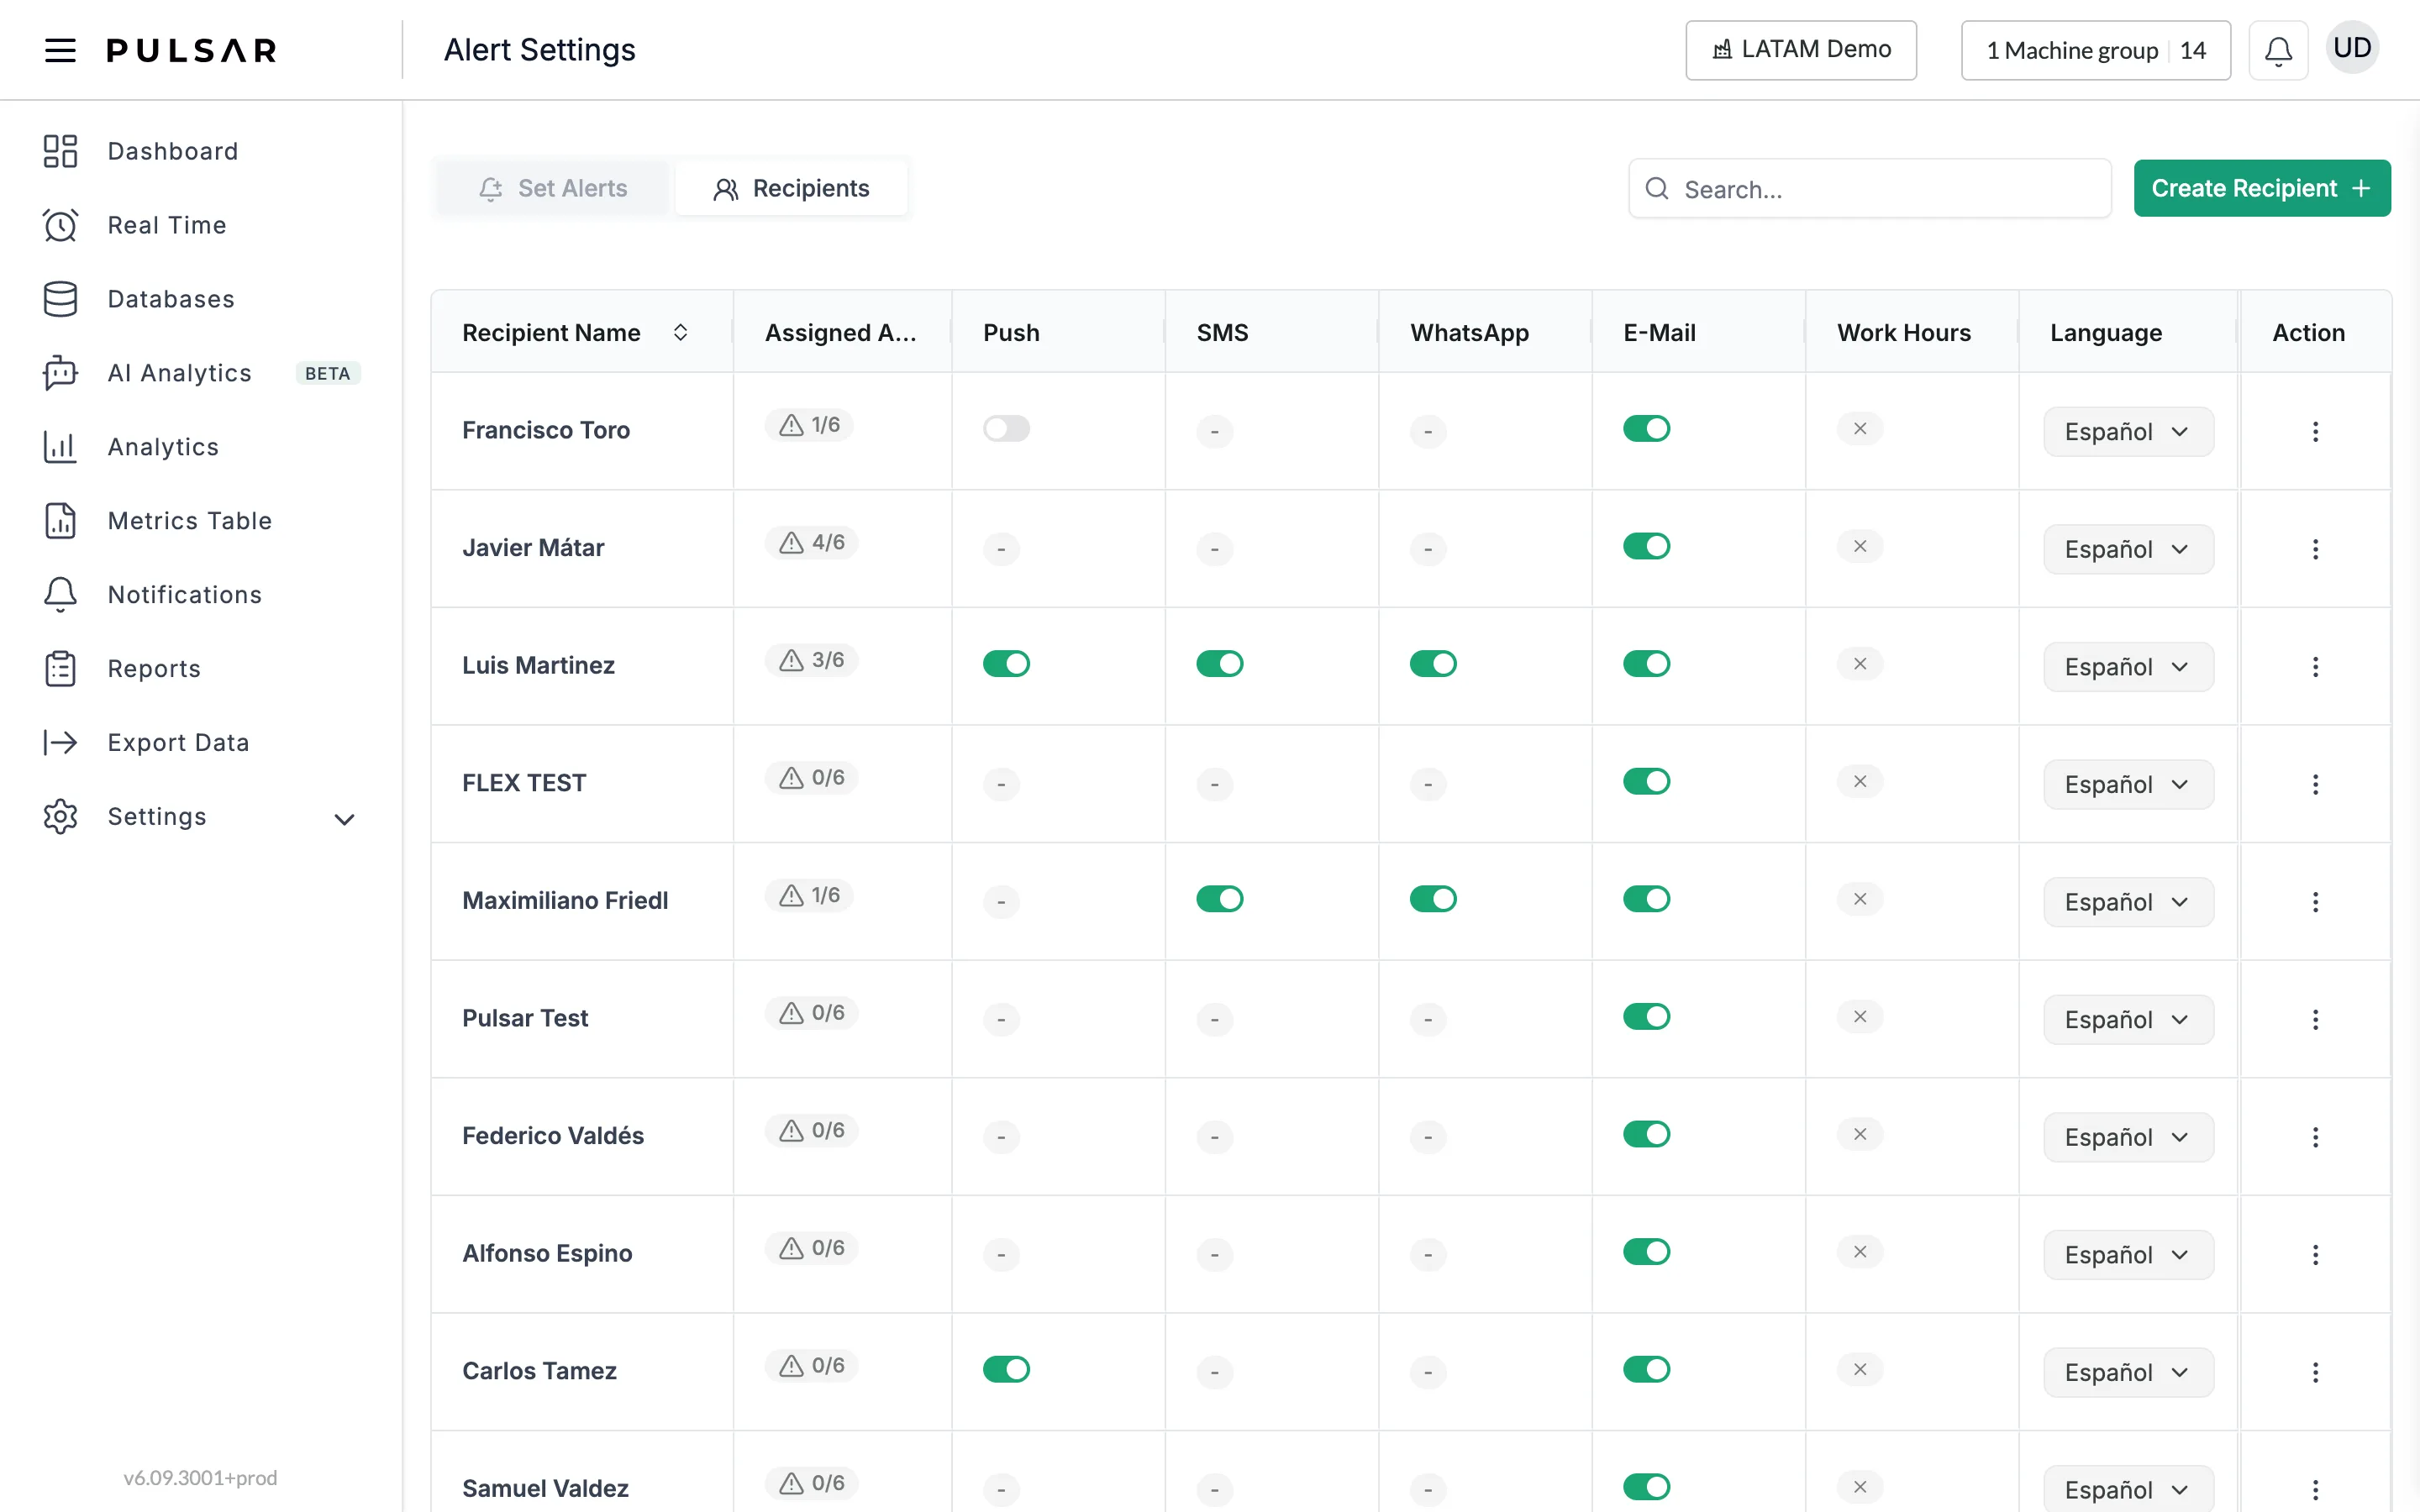
The Recipients tab lists every recipient with their Assigned Alerts, the channels they receive alerts on (Push, SMS, WhatsApp and E-Mail, each with a switch), their Work Hours and their Language.
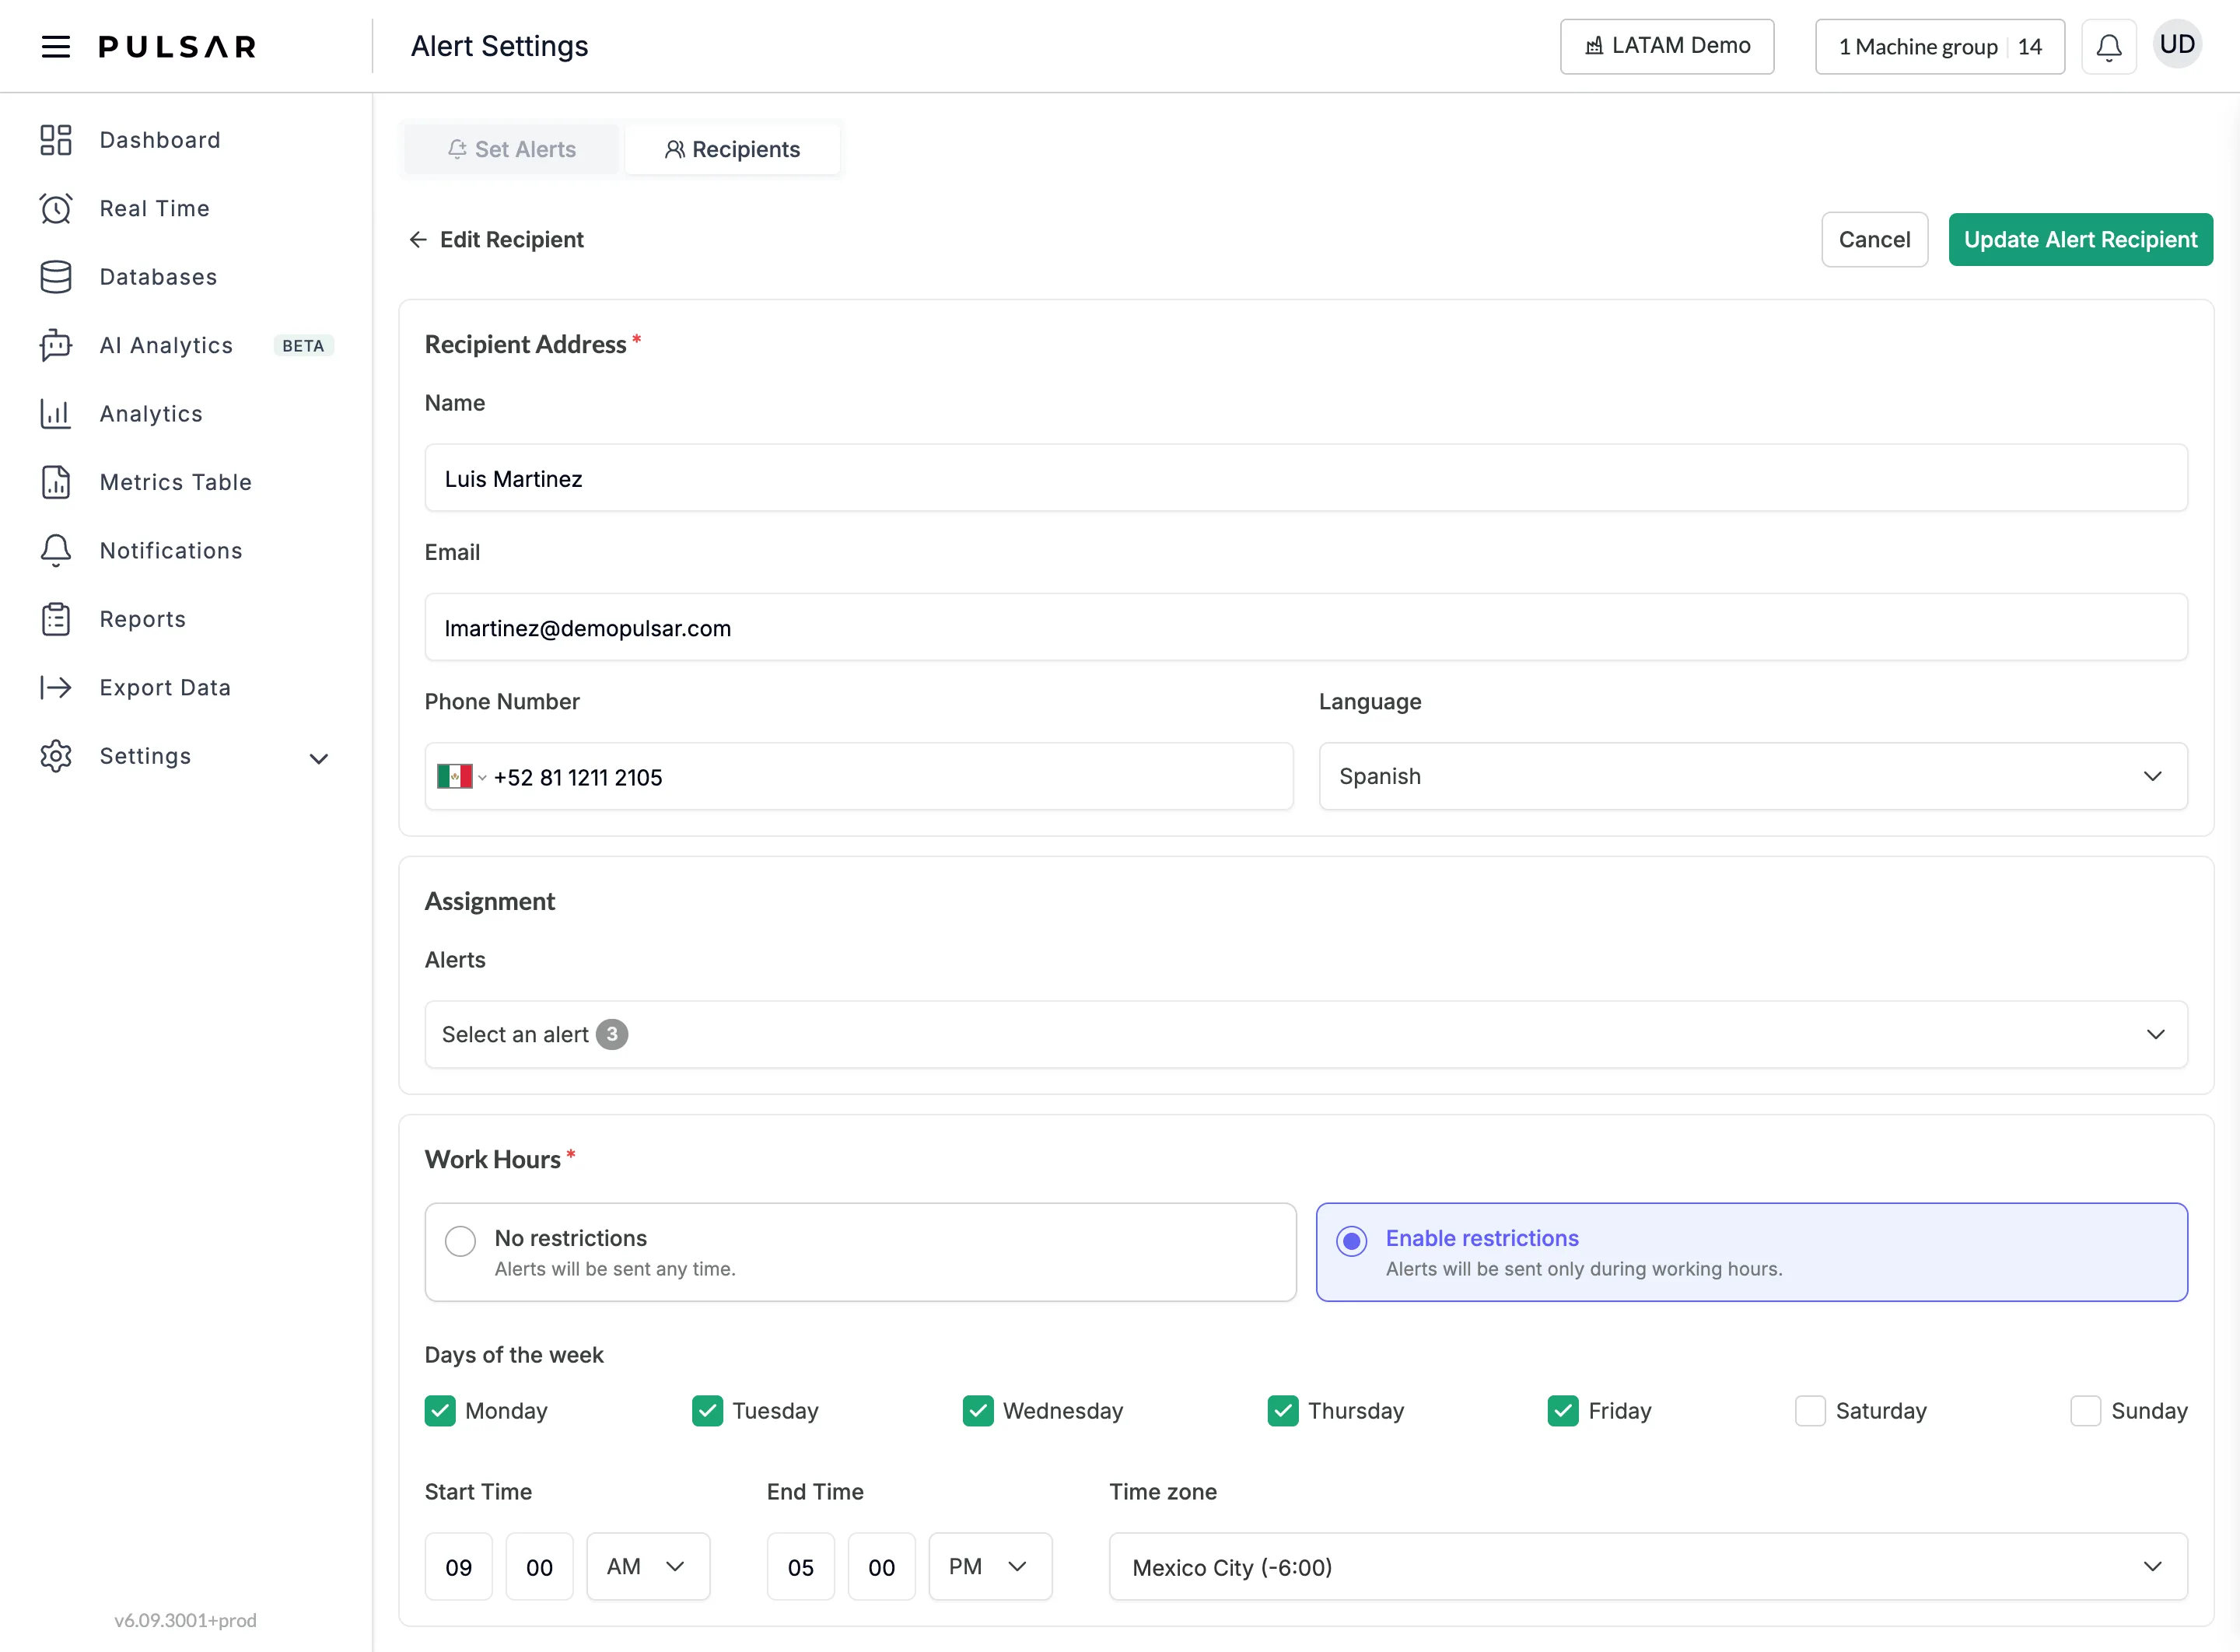
To change a recipient, click the three dots (⋮) in the Action column and then Edit. On the Edit Recipient page you can:
- update the Name, Email, Phone Number (with its country code) and Language (English or Spanish) under Recipient Address
- assign or change their Alerts under Assignment
- under Work Hours, keep No restrictions (alerts are sent any time) or choose Enable restrictions to receive alerts only during working hours: pick the Days of the week, the Start Time, the End Time and the Time zone
Click Update Alert Recipient to save, or Cancel.
Add recipients without Pulsar access
Besides active users, you can create recipients who don't have access to Pulsar (no username or password) but still receive alerts or reports. On the Recipients tab, click Create Recipient.
The Create Alert Recipient page has the same fields as the edit page (contact details, language, alerts and work hours). Click Create Recipient to add them. They exist only in the Alerts section and can't sign in to the main platform.

See triggered alerts
When an alert is triggered, you can find it in two places.
From the alerts button
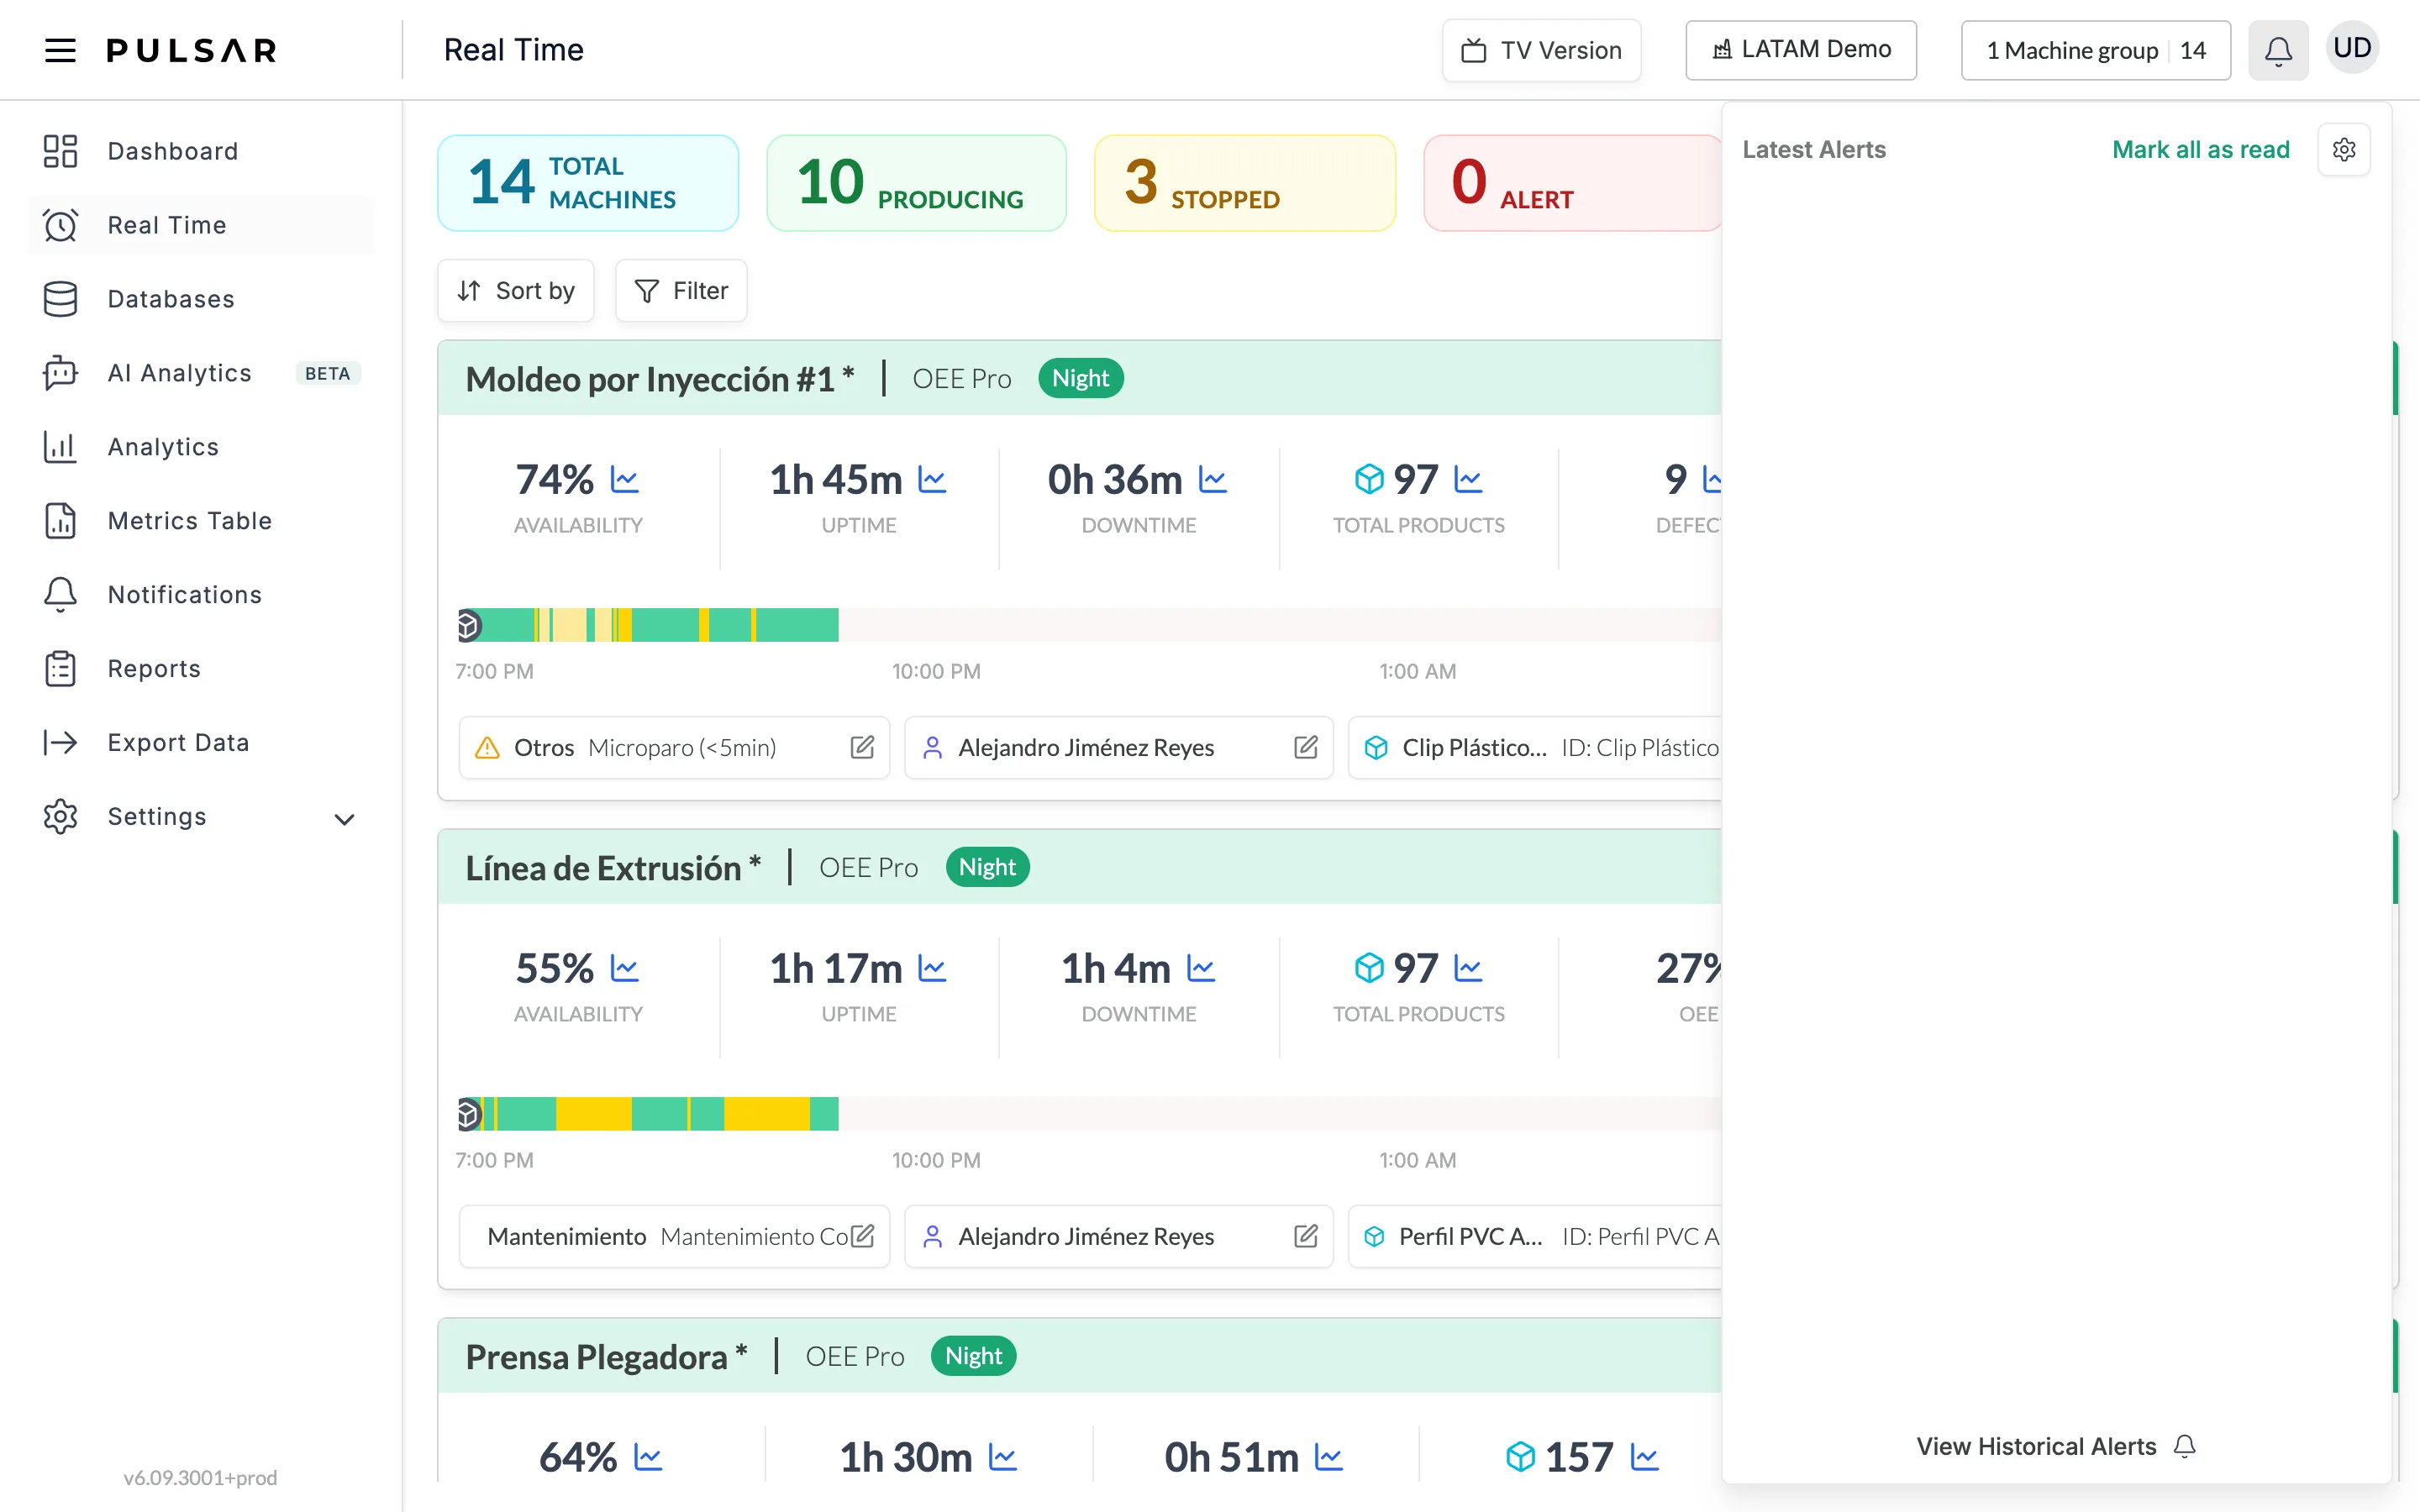
Click the bell at the top right of the page. The Latest Alerts panel lists the most recent alerts. From there you can Mark all as read or open the full list with View Historical Alerts.
From Notifications
Open Notifications in the left-hand menu. There you can:
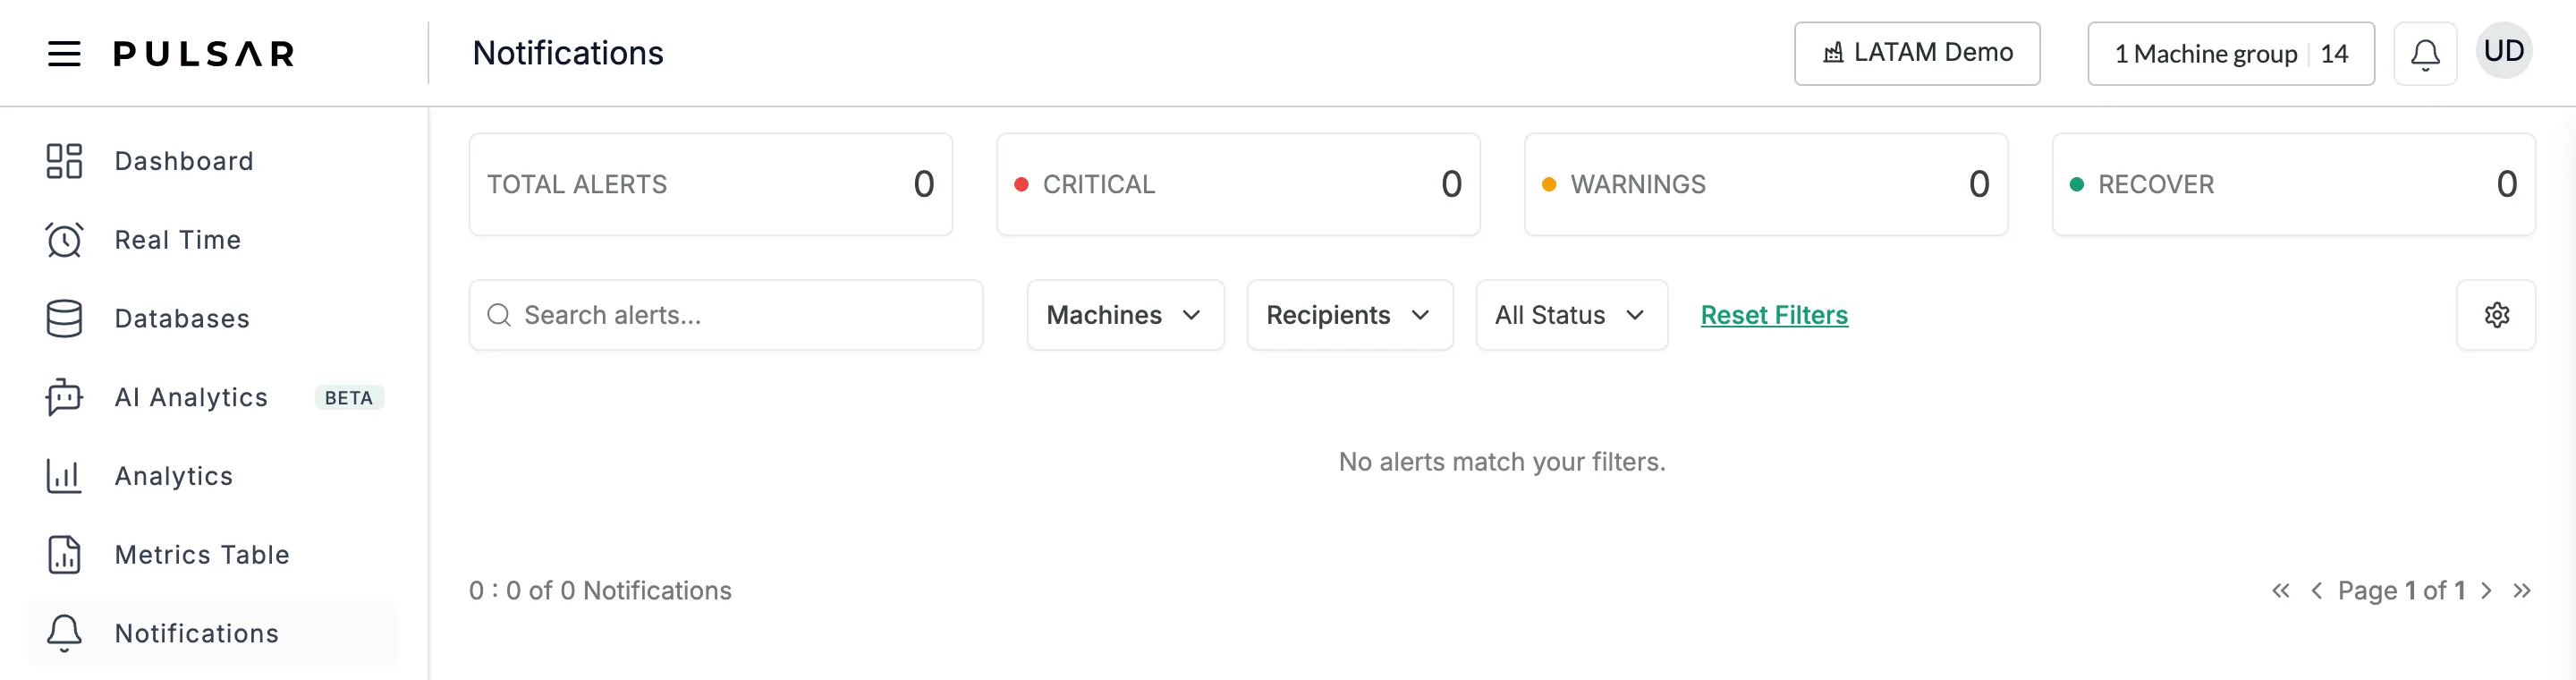
- see how many alerts you've received in total, and how many are CRITICAL, WARNINGS or RECOVER
- search the alerts, and filter them by Machines, by Recipients, or by status (All Status, Read or Unread); Reset Filters clears them
- open the alert settings with the gear icon, if you need to adjust something
- click an alert to see the details of what triggered it, with a shortcut to the machine in Real Time