Planned and unplanned stops
Mark specific causes as planned stops, set how long each planned stop should last, and see when one runs over.
For an accurate productivity analysis, you need to separate planned stops from unplanned ones. You do it by marking specific causes in your stop labels as planned, and optionally setting how long each one should last.
Video
Mark a cause as a planned stop
Go to Settings > Stops and open the Stop Labels tab.
Under Specific Stop Causes, find the cause you want to treat as a planned stop. The Search... box at the top right helps in a long list.
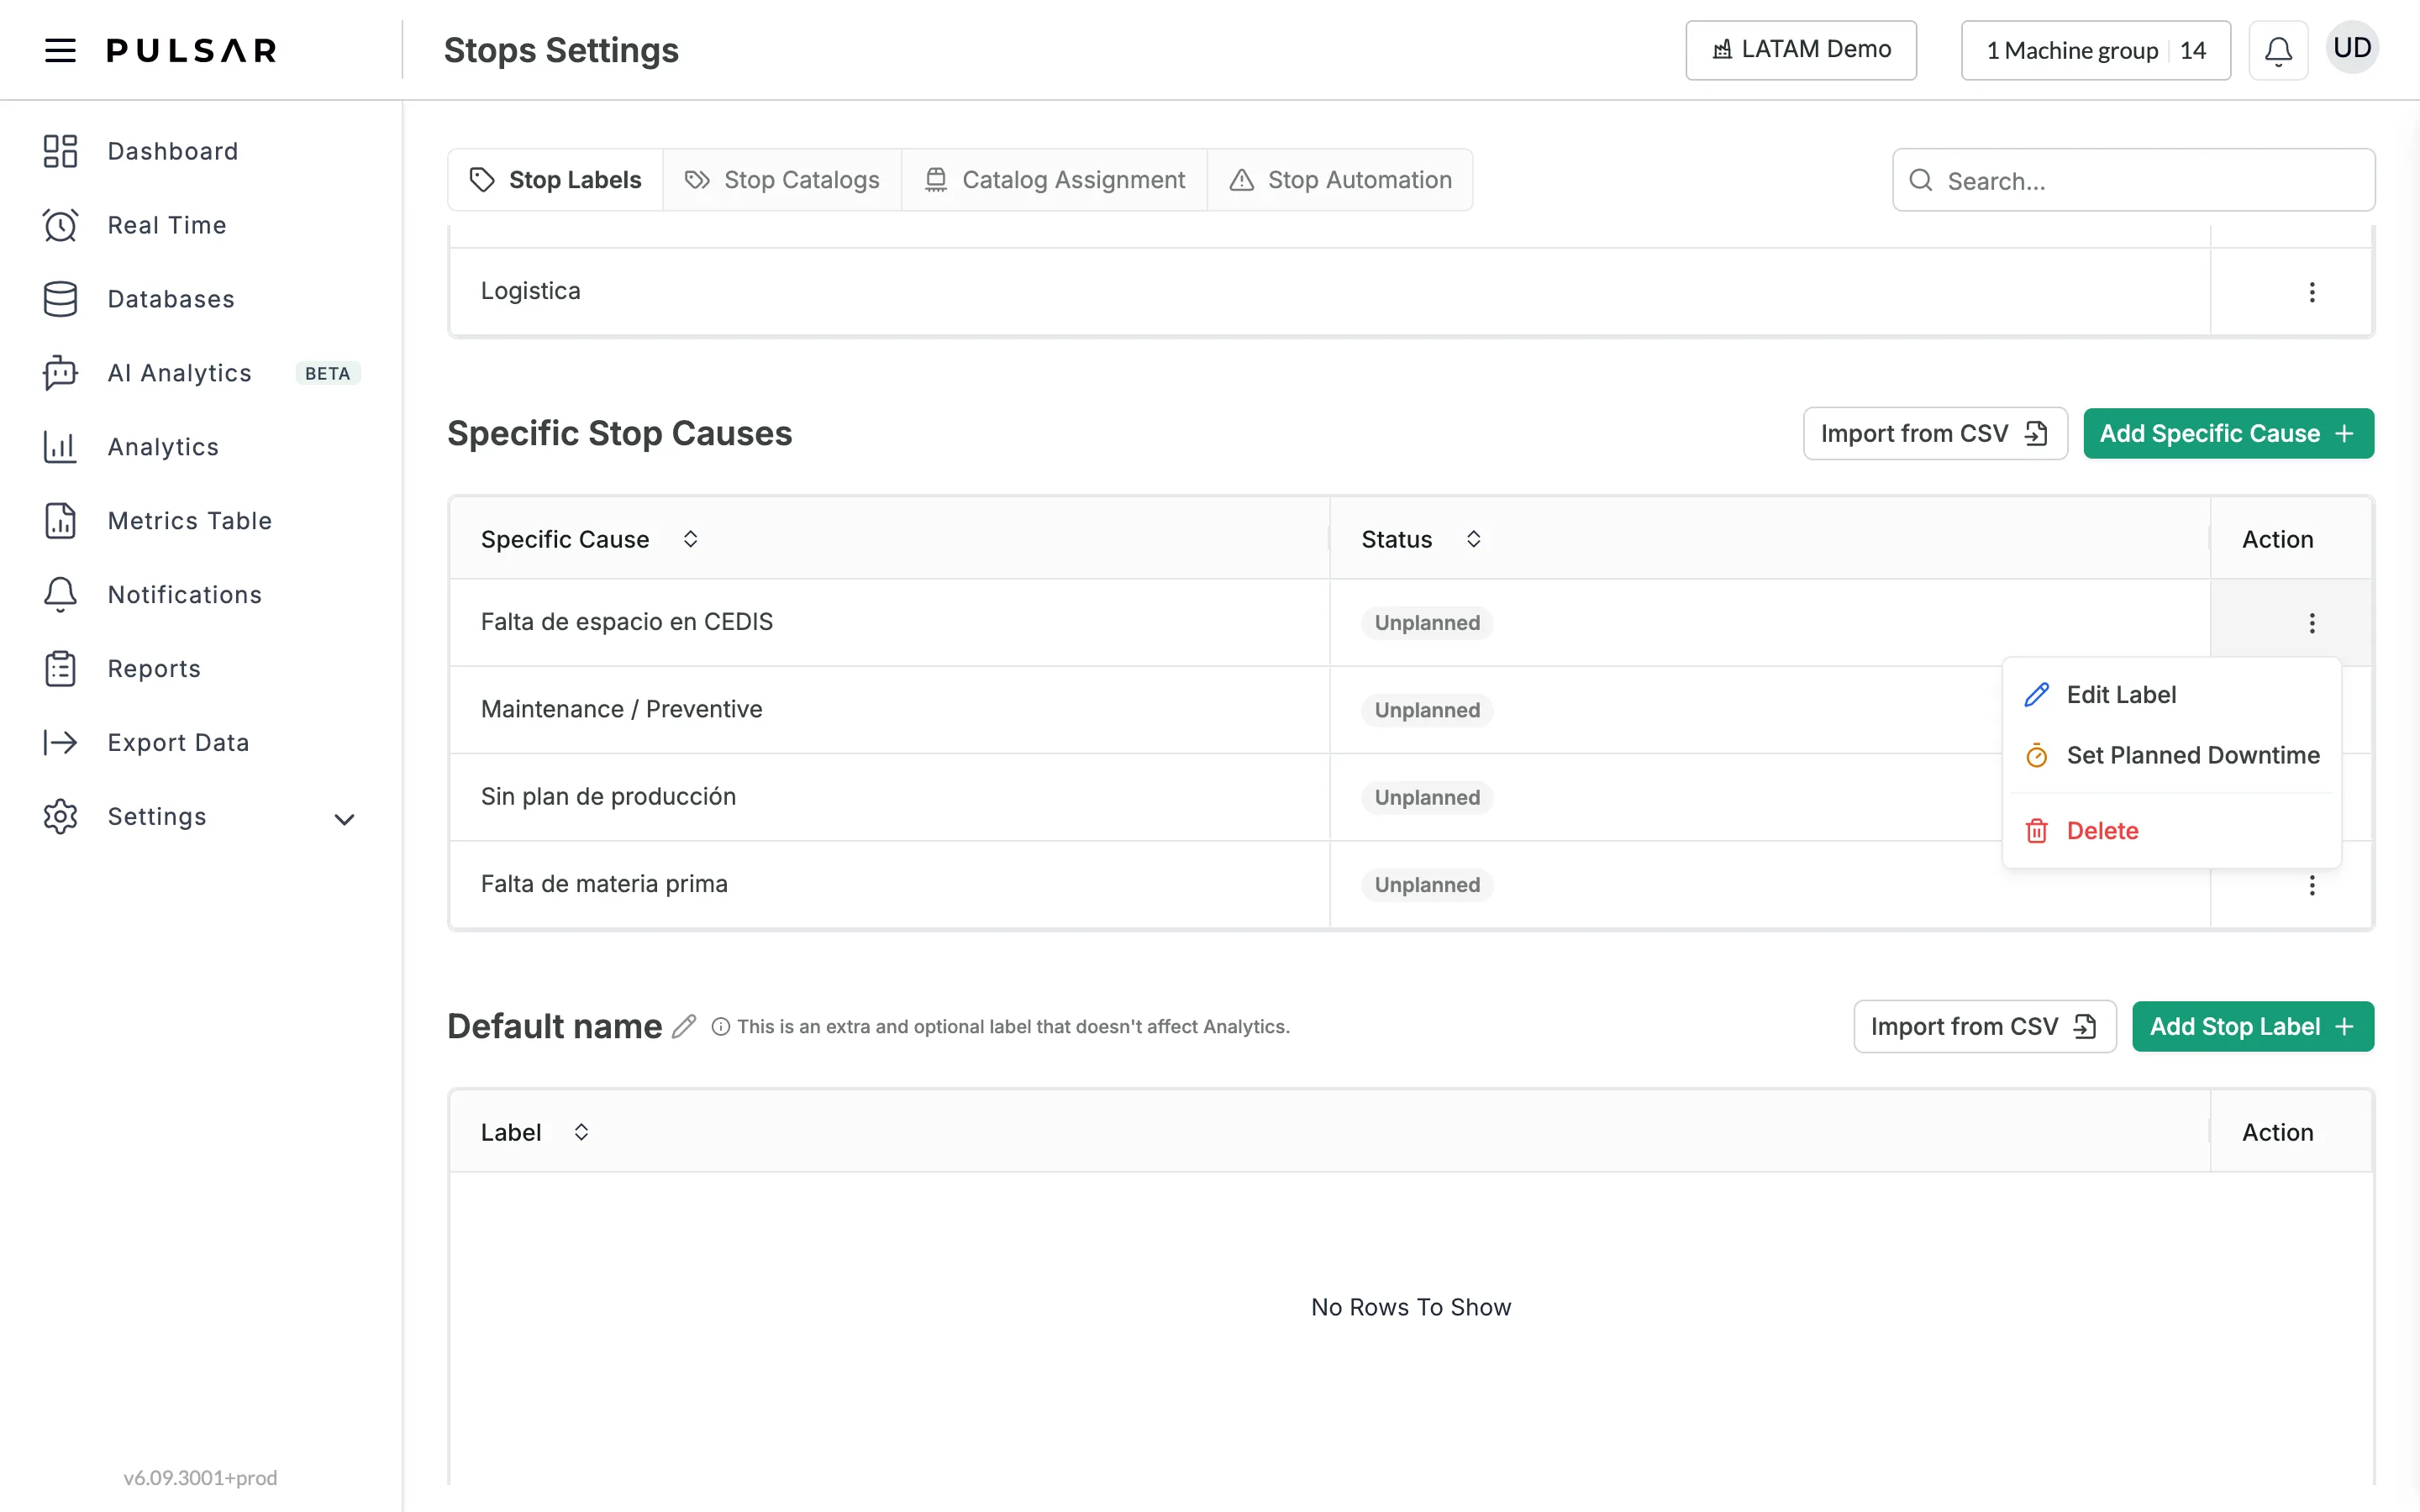
Click the three dots (⋮) in its Action column and choose Set Planned Downtime.
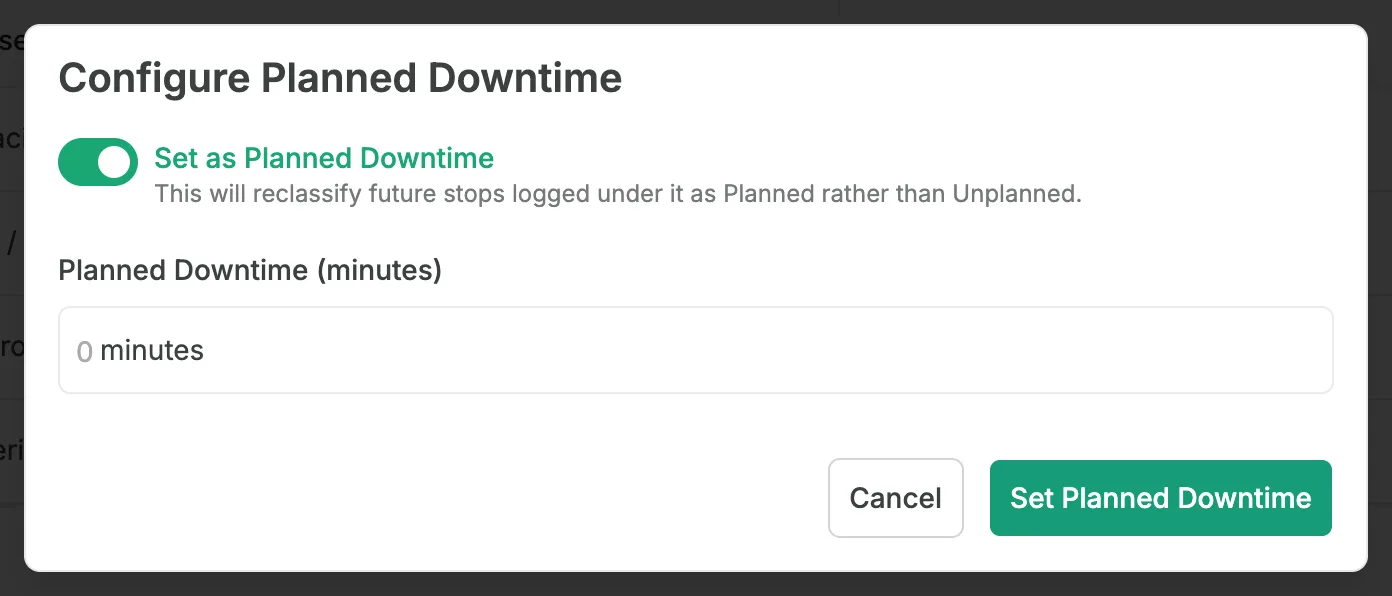
In the Configure Planned Downtime window, turn on Set as Planned Downtime. In Planned Downtime (minutes), enter how many minutes that planned stop should take. If you don't know, leave it at 0. Then click Set Planned Downtime.
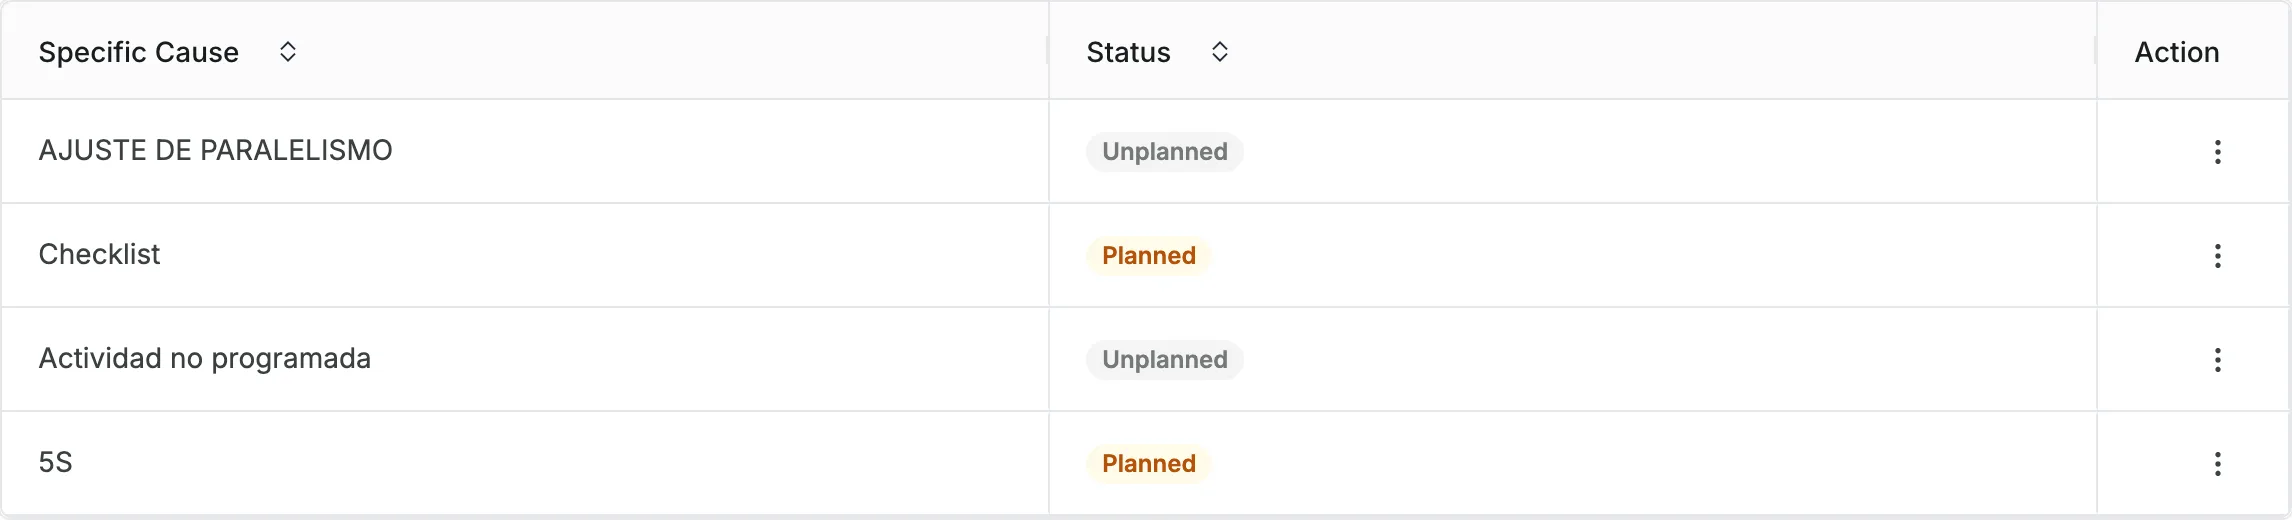
The cause's Status column now shows Planned instead of Unplanned. The change applies to future stops logged under that cause: they are classified as planned rather than unplanned. To change the planned time later, open Set Planned Downtime again.
Planned stops are not counted as losses in the net indicators in Analytics: they are not part of the shift time. If you use this setting, we recommend basing your analysis on those indicators.
See when a planned stop runs over
Go to Analytics and open the Planned Downtime dashboard. The Programmed stops page compares, for each cause, the planned time with the time it ran over, in the Exceeded planned downtime chart (Exceeded downtime (minutes) and Planned downtime (minutes)) and the Average planned downtime chart. Filter it by Date Range, Machines and Specific Causes.
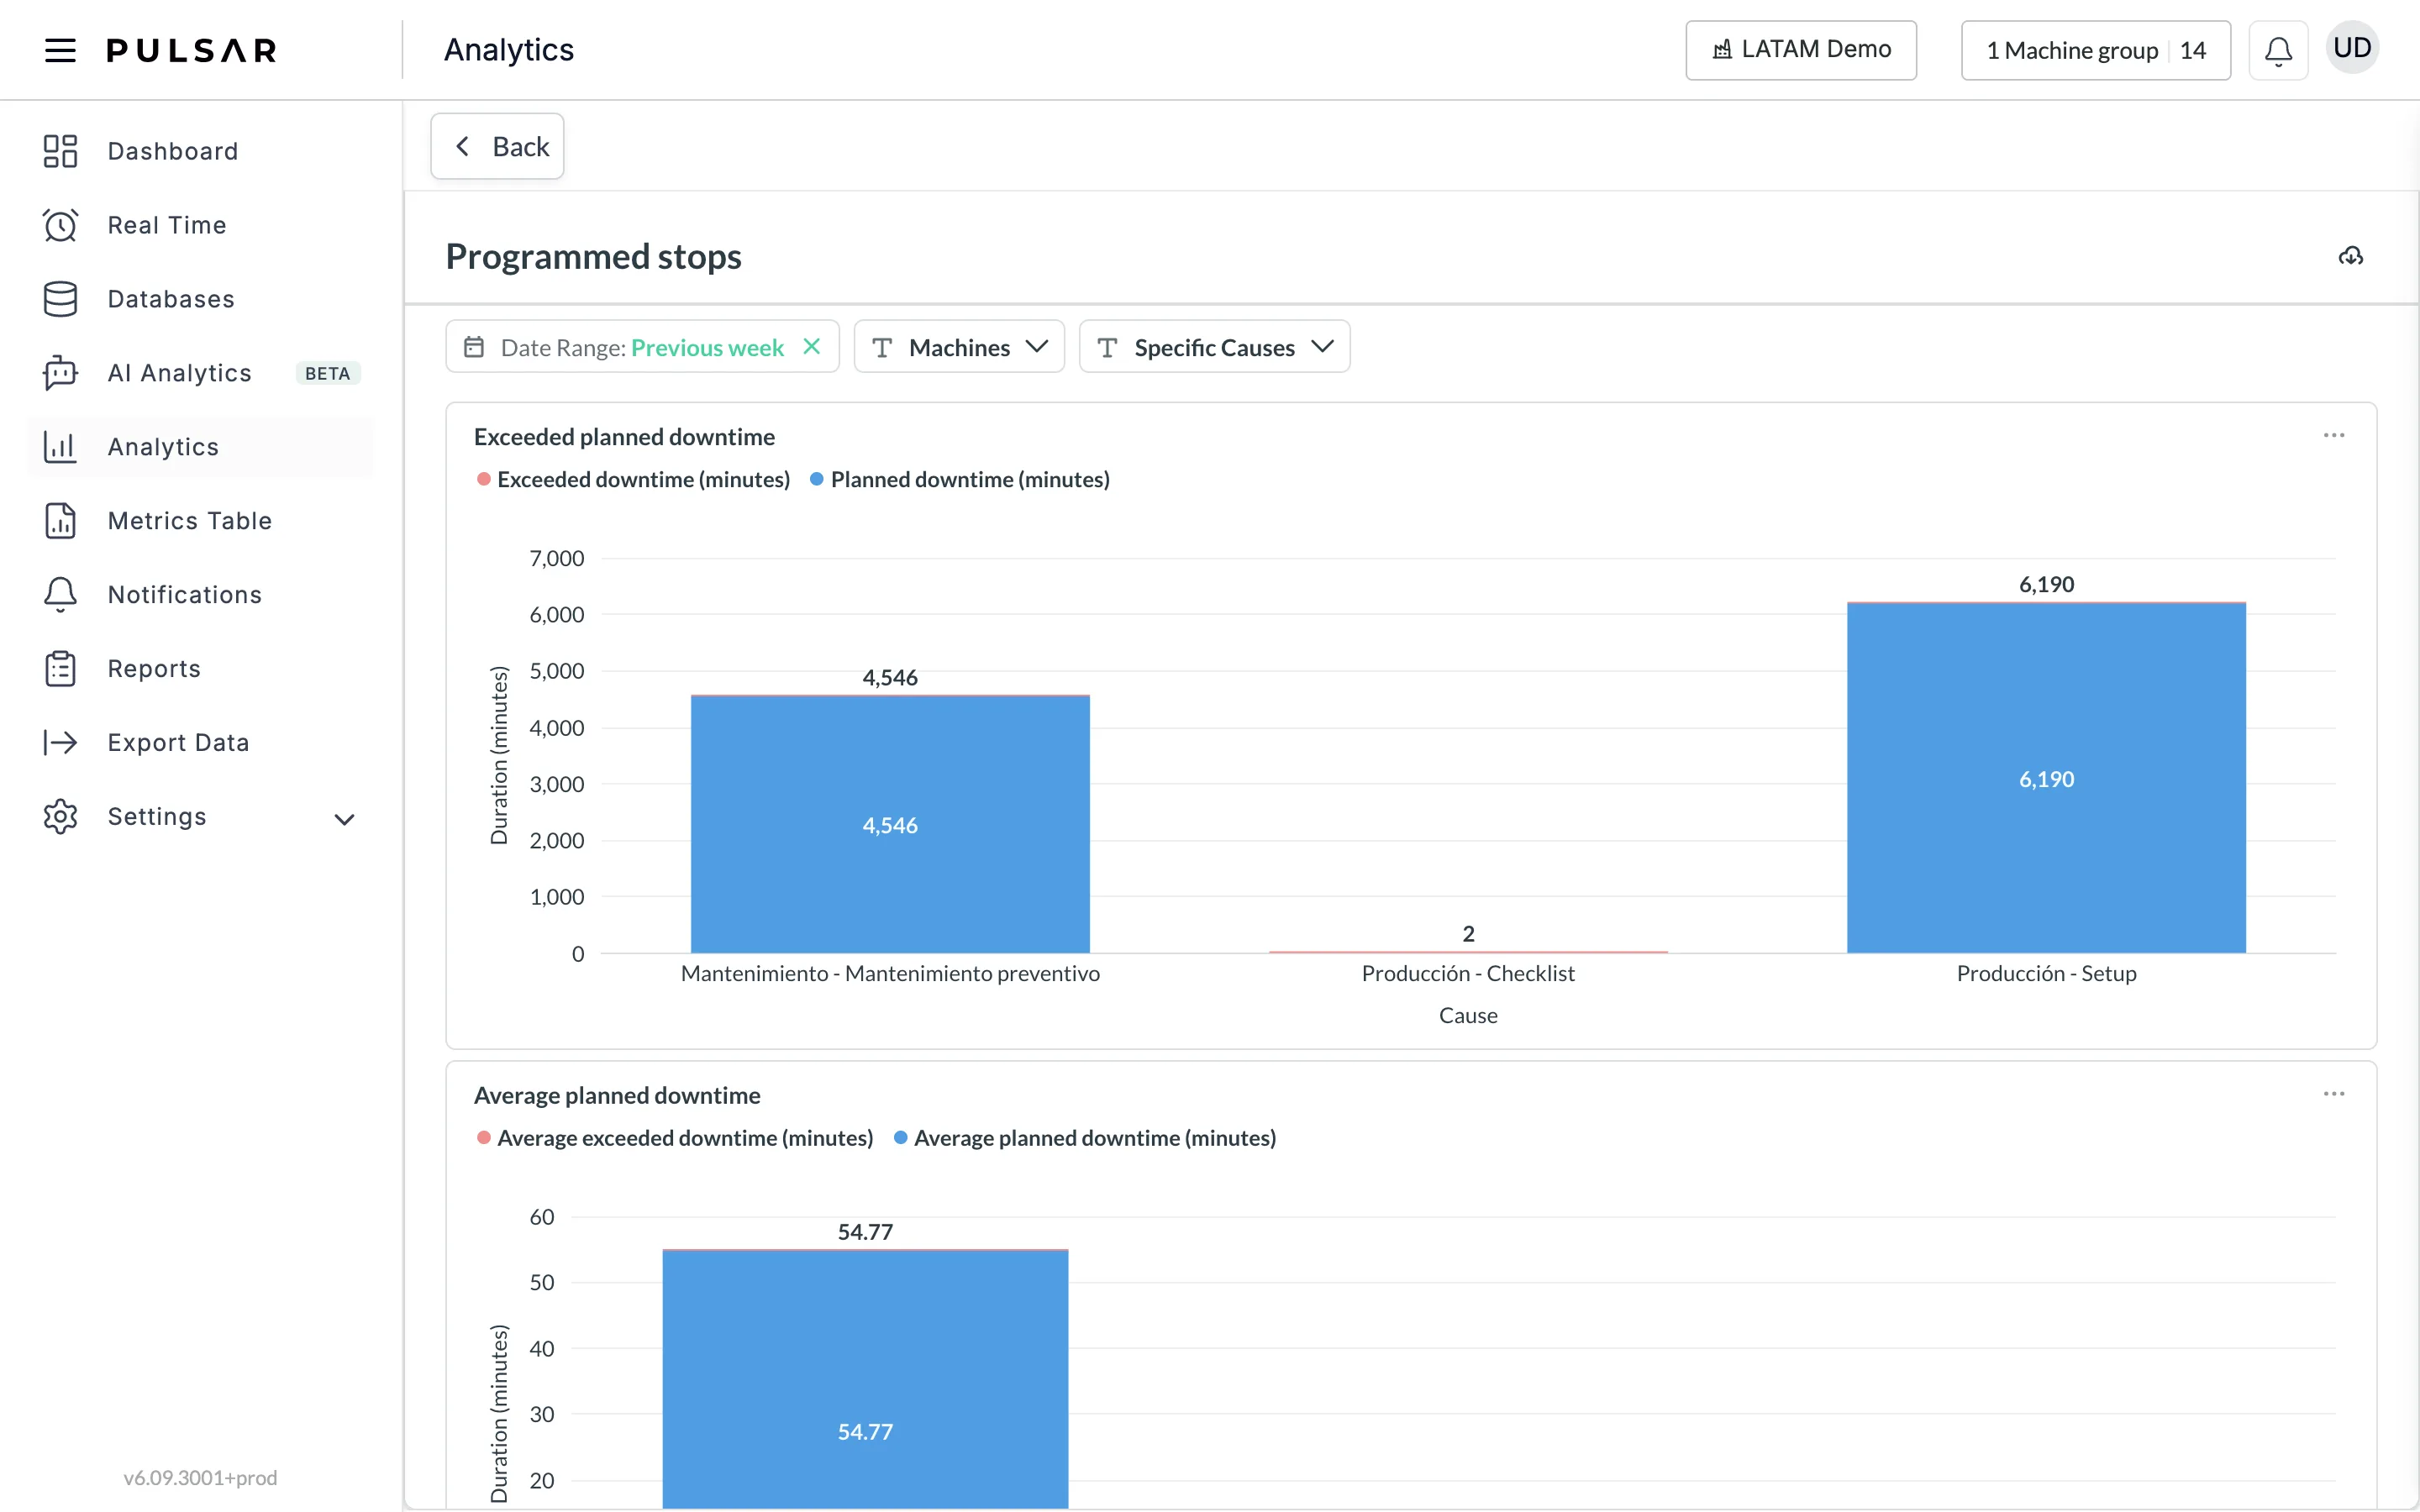
This only shows the excess time of a planned stop. When you classify stops, you still have to split the stop manually.
If you have trouble setting up planned stops or need help, contact your Customer Success representative or raise a support ticket from the app.