Hardware status
See whether a machine's Smart Hub was connected, and when it powered on or off, from its card in Real Time.
Hardware status shows the connection history of the Pulsar Smart Hub on a machine: when it was sending data to the internet in real time, when it only had Wi-Fi or no router, when it had no power, and when it powered on or off. Use it to find out whether a gap in a machine's data was a connectivity or power problem. You open it from the machine's card in Real Time.
Open the hardware status
Click the chip icon on the machine's card
In Real Time, find the machine's card and click the chip icon, Hardware status, at the right end of the card's buttons, next to the gear icon. A window opens with the machine's name and Hardware status at the top.
Choose the dates
The window starts on the card's current shift. To see other days, click the date range at the top right and pick the start and end dates on the calendar. The range is limited to 7 days: if you pick a wider one, the app keeps the day you just clicked and moves the other end so the range is exactly 7 days.
Timeline
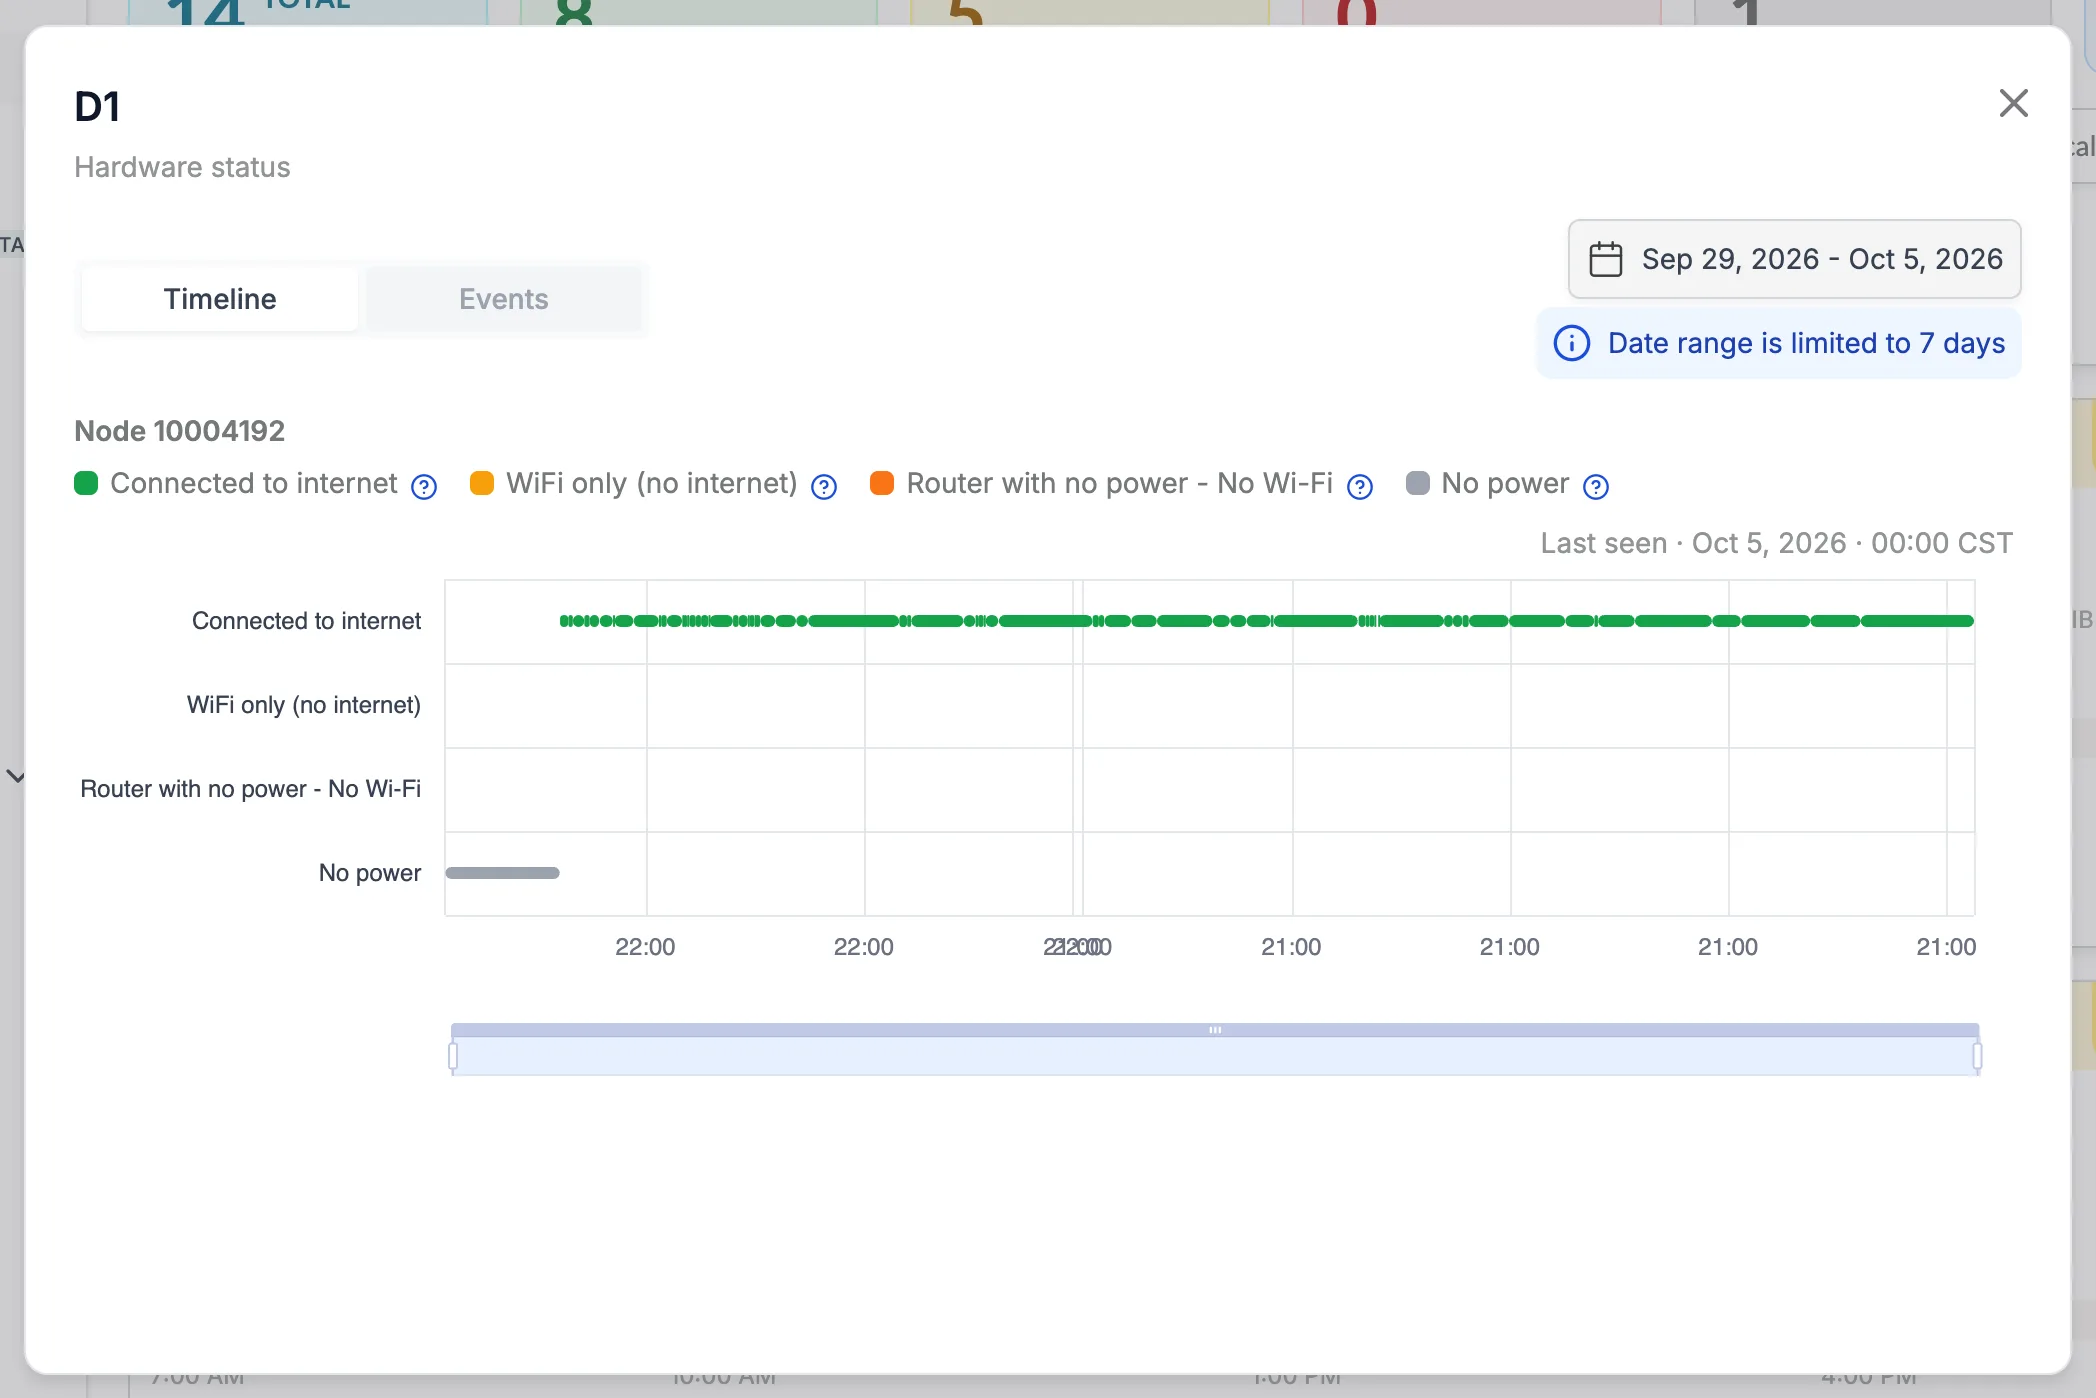
Timeline, the tab the window opens on, shows one chart per Smart Hub node, labelled Node and the node's number. Each period is drawn as a bar on the row of the state the node was in:
- Connected to internet: data was transmitted in real time as it was captured.
- WiFi only (no internet): the router was connected to the Wi-Fi network but had no internet connection. Data was stored locally and uploaded automatically once the internet came back.
- Router with no power - No Wi-Fi: the router was powered off or unavailable. Data was stored locally and uploaded automatically once the router was powered back on.
- No power: the Smart Hub lost power and couldn't collect or store data until power was restored.
The question-mark icon next to each state in the legend shows the same description. Last seen, above the chart, is the last time the node reported. Drag the handles of the slider under the chart to zoom into part of the range.
If the node sent nothing in the range, the tab shows No connectivity status in the selected range.
Events
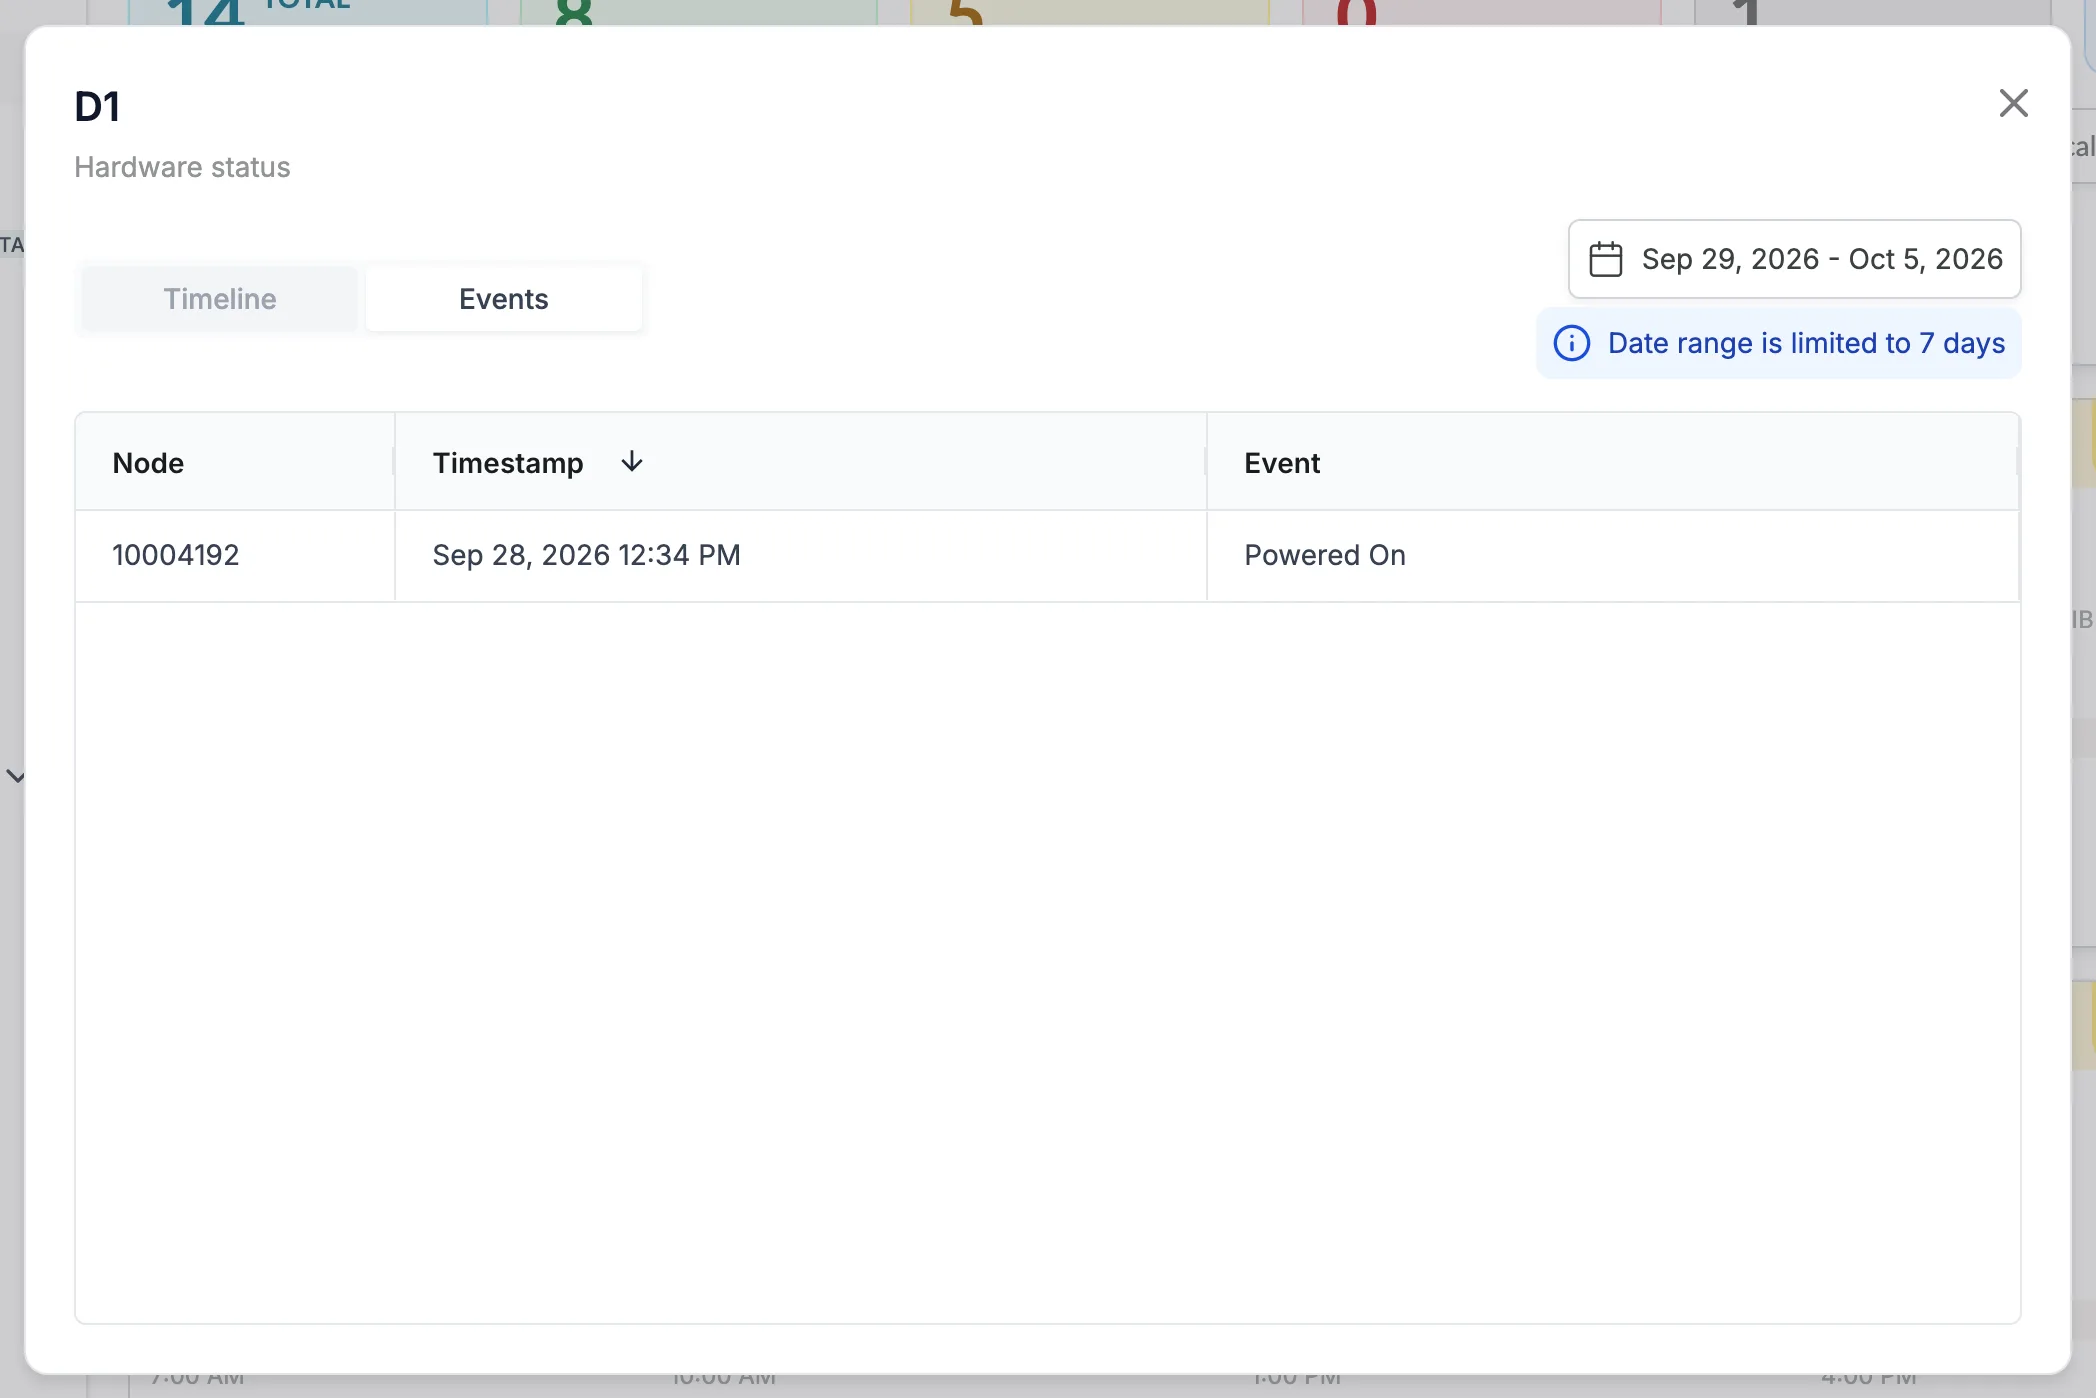
Events lists the power events of the Smart Hub in the range, in a table with the columns Node, Timestamp and Event. The event is Powered On or Powered Off. Click a column header to sort by it. When there are no events in the range, the tab shows No events in the selected range.
If a machine has no data, see Machine without data and Machine running but showing 0%.